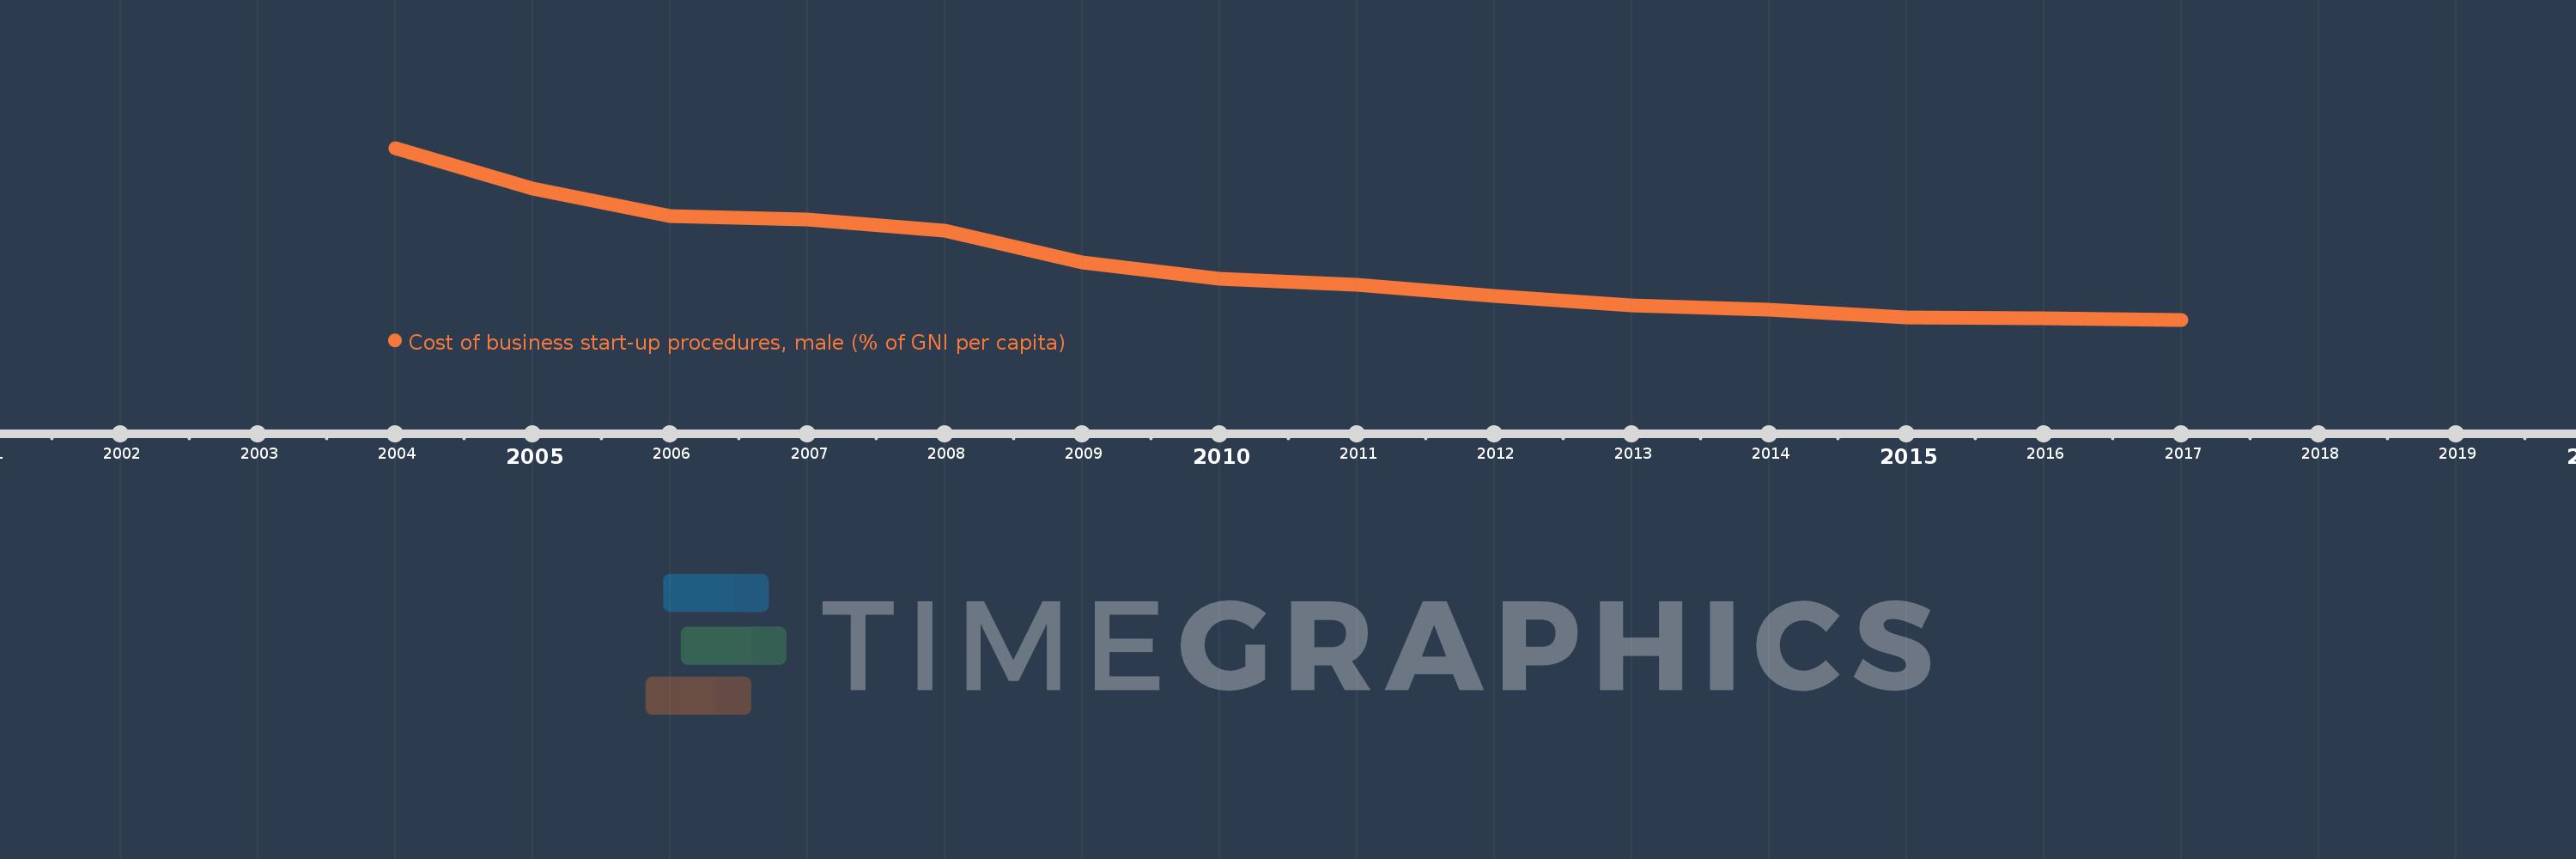
This timeline shows a graph from 2004 to 2017 of Sub-Saharan Africa (excluding high income). No data until 2003. Number of actual observations by date: 14.
Source name:
World Development Indicators
Source organization:
World Bank, Doing Business project (http://www.doingbusiness.org/).
Categories, topics:
Private Sector
Last updated:
apr 23, 2017
Indicators value changes by year
Meaning:
134.443
Minimum:
54.909
jan 1, 2017
Maximum:
300.061
jan 1, 2004
At the date of observation
Value
Absolute change
Change from the previous value
jan 1, 2004
300.061
+300.061
0.0%
jan 1, 2005
241.7
-58.361
-19.45%
jan 1, 2006
202.427
-39.273
-16.25%
jan 1, 2007
198.358
-4.069
-2.01%
jan 1, 2008
181.782
-16.576
-8.36%
jan 1, 2009
136.898
-44.884
-24.69%
jan 1, 2010
113.96
-22.938
-16.76%
jan 1, 2011
104.596
-9.364
-8.22%
jan 1, 2012
88.271
-16.324
-15.61%
jan 1, 2013
75.265
-13.006
-14.73%
jan 1, 2014
69.654
-5.611
-7.45%
jan 1, 2015
57.693
-11.961
-17.17%
jan 1, 2016
56.632
-1.062
-1.84%
jan 1, 2017
54.909
-1.723
-3.04%
Ranking of countries by current statistics by years