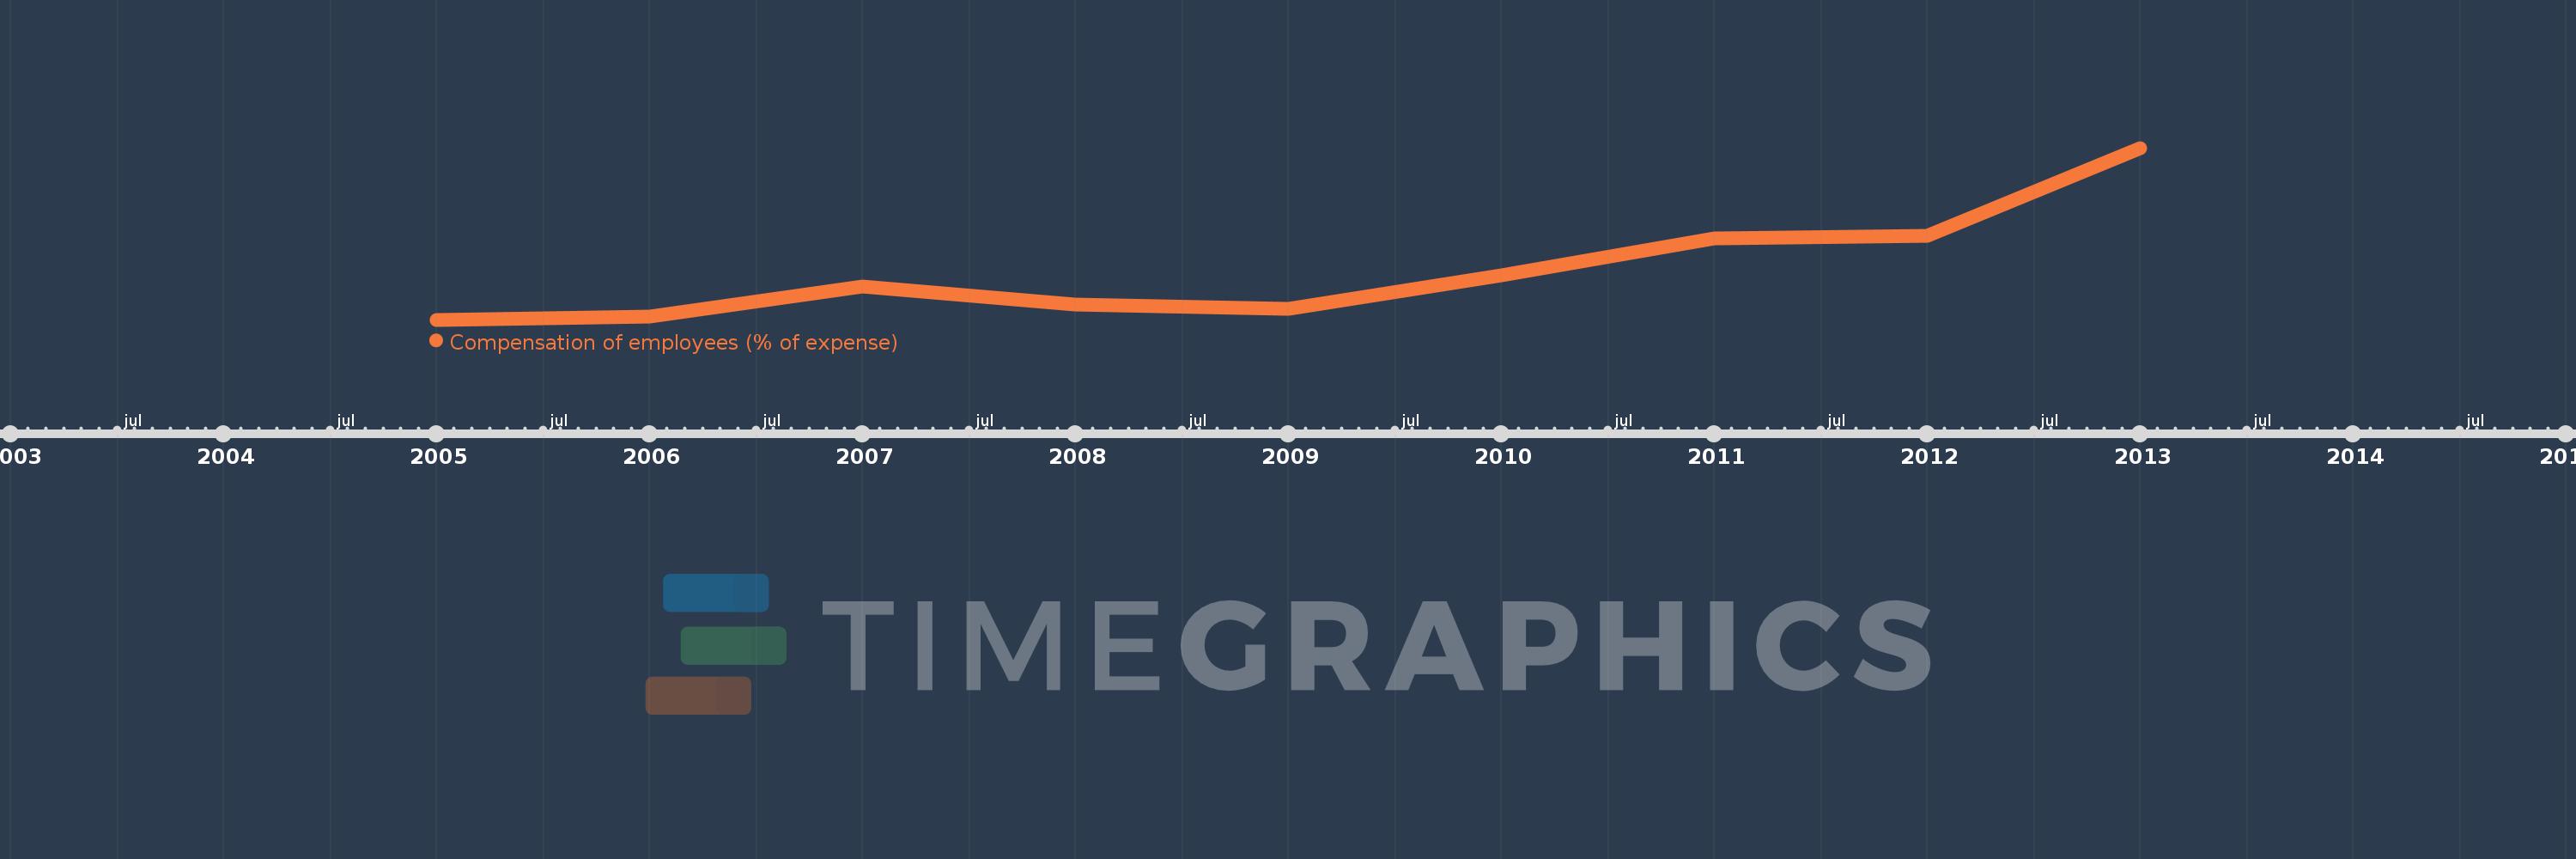
This timeline shows a graph from 2005 to 2013 of Sub-Saharan Africa (IDA & IBRD countries). No data until 2004. Number of actual observations by date: 9.
Source name:
World Development Indicators
Source organization:
International Monetary Fund, Government Finance Statistics Yearbook and data files.
Categories, topics:
Public Sector
Last updated:
apr 23, 2017
Indicators value changes by year
Meaning:
37.071
Minimum:
35.545
jan 1, 2005
Maximum:
40.851
jan 1, 2013
At the date of observation
Value
Absolute change
Change from the previous value
jan 1, 2005
35.545
+35.545
0.0%
jan 1, 2006
35.64
+0.095
0.27%
jan 1, 2007
36.581
+0.941
2.64%
jan 1, 2008
36.017
-0.564
-1.54%
jan 1, 2009
35.872
-0.145
-0.4%
jan 1, 2010
36.915
+1.043
2.91%
jan 1, 2011
38.066
+1.151
3.12%
jan 1, 2012
38.149
+0.083
0.22%
jan 1, 2013
40.851
+2.702
7.08%
Ranking of countries by current statistics by years