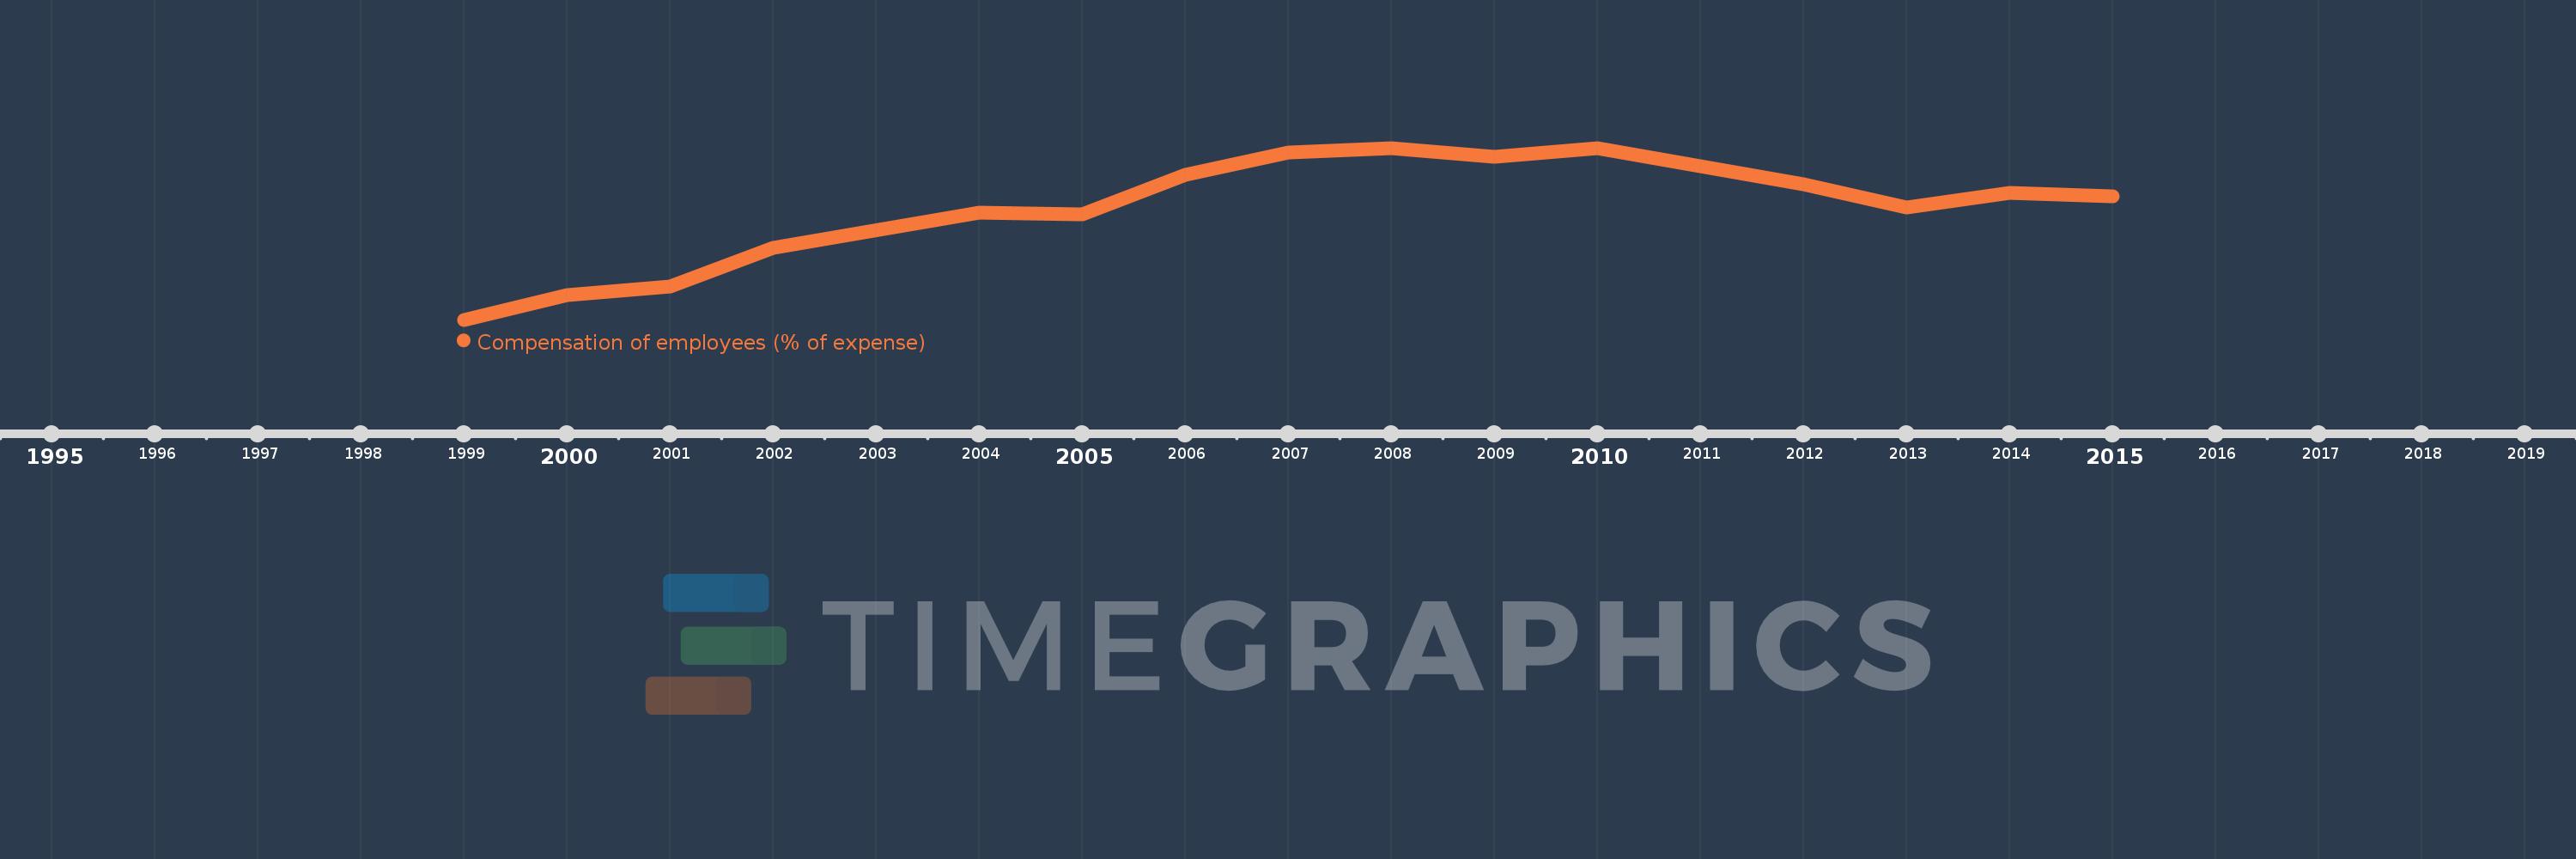
This timeline shows a graph from 1999 to 2015 of Europe & Central Asia (excluding high income). No data until 1998. Number of actual observations by date: 16.
Source name:
World Development Indicators
Source organization:
International Monetary Fund, Government Finance Statistics Yearbook and data files.
Categories, topics:
Public Sector
Last updated:
apr 23, 2017
Indicators value changes by year
Meaning:
16.062
Minimum:
10.904
jan 1, 1999
Maximum:
18.728
jan 1, 2010
At the date of observation
Value
Absolute change
Change from the previous value
jan 1, 1999
10.904
+10.904
0.0%
jan 1, 2000
12.01
+1.106
10.15%
jan 1, 2001
12.426
+0.416
3.47%
jan 1, 2002
14.191
+1.765
14.2%
jan 1, 2004
15.778
+1.587
11.18%
jan 1, 2005
15.71
-0.069
-0.43%
jan 1, 2006
17.495
+1.786
11.37%
jan 1, 2007
18.503
+1.007
5.76%
jan 1, 2008
18.704
+0.202
1.09%
jan 1, 2009
18.311
-0.393
-2.1%
jan 1, 2010
18.728
+0.417
2.28%
jan 1, 2011
17.908
-0.82
-4.38%
jan 1, 2012
17.083
-0.825
-4.61%
jan 1, 2013
16.015
-1.068
-6.25%
jan 1, 2014
16.689
+0.674
4.21%
jan 1, 2015
16.541
-0.148
-0.88%
Ranking of countries by current statistics by years