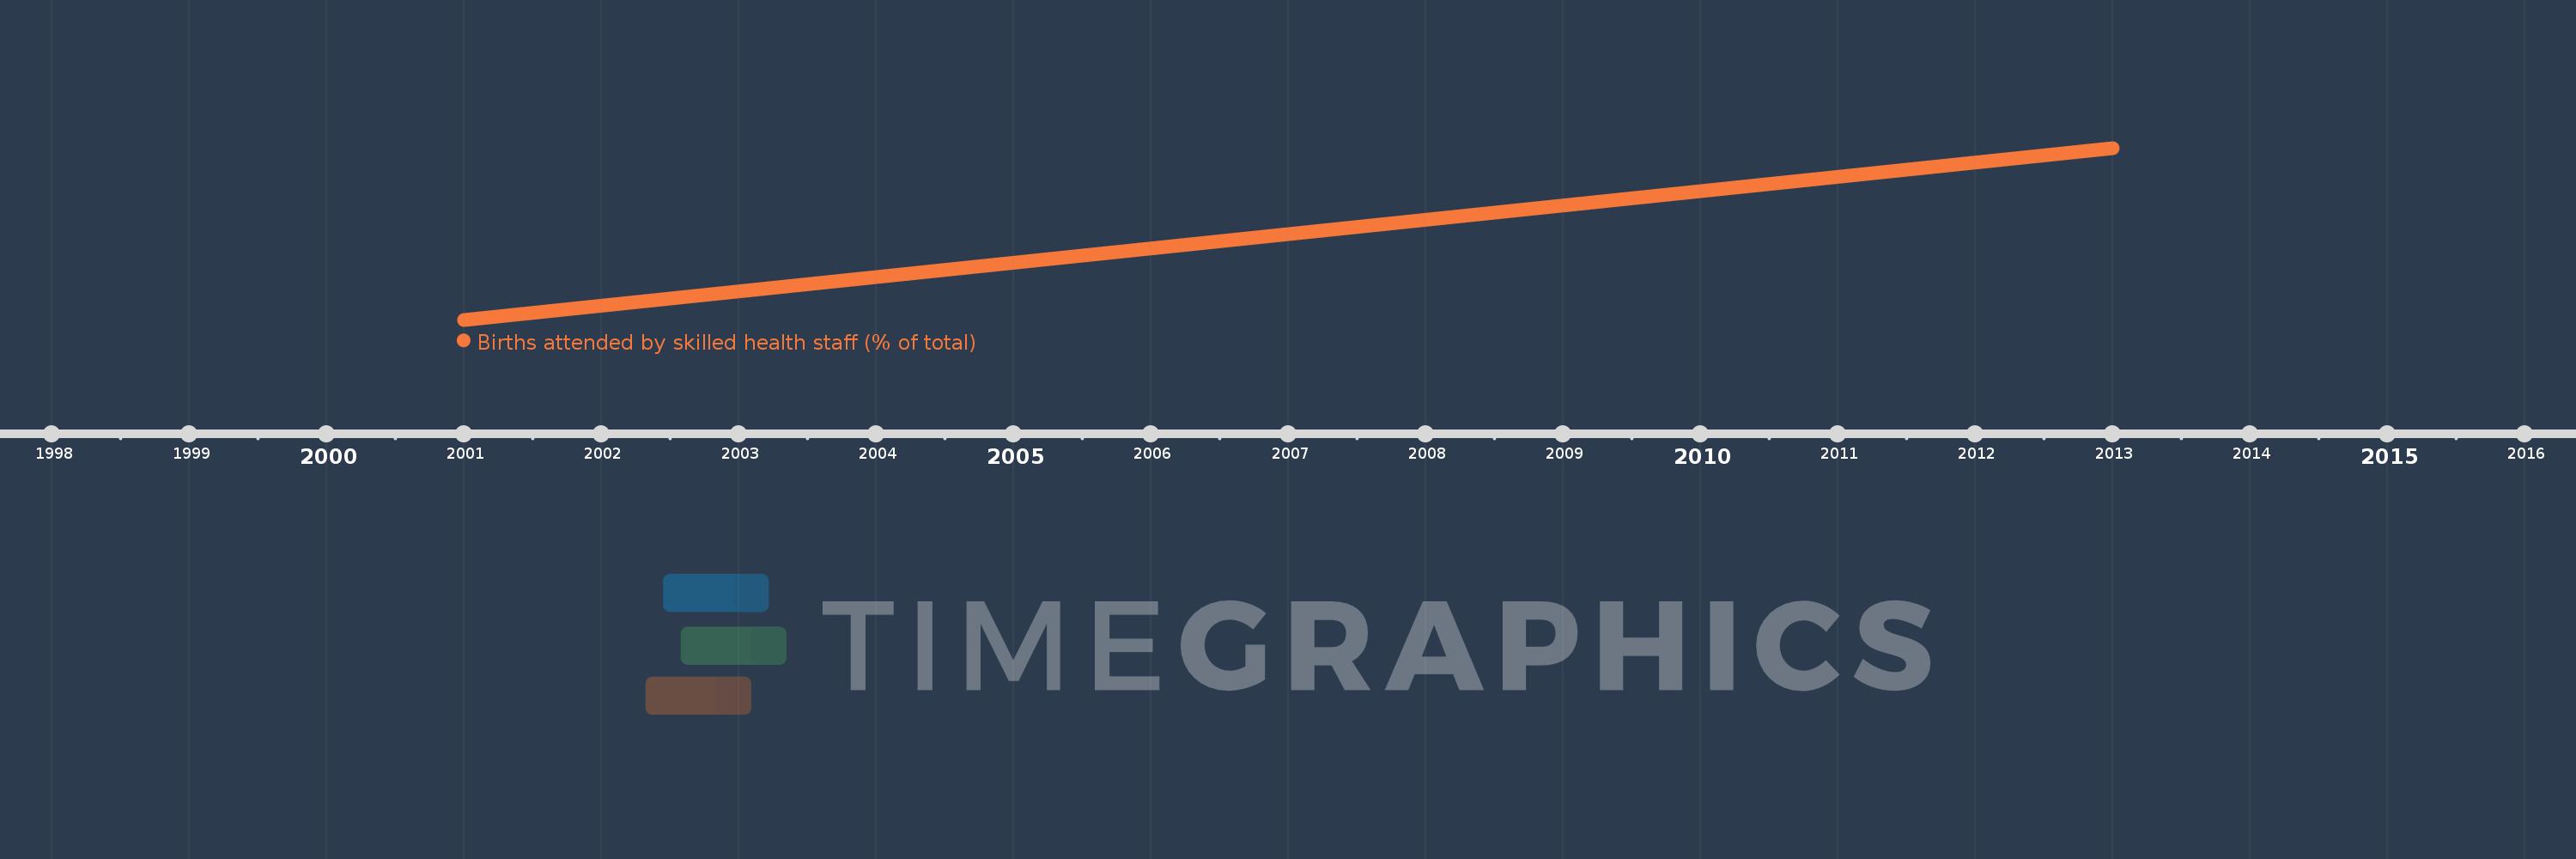
This timeline shows a graph from 2001 to 2013 of Sub-Saharan Africa (IDA & IBRD countries). No data until 2000. Number of actual observations by date: 2.
Source name:
World Development Indicators
Source organization:
UNICEF, State of the World's Children, Childinfo, and Demographic and Health Surveys.
Categories, topics:
Health, Gender
Last updated:
apr 23, 2017
Indicators value changes by year
Meaning:
46.792
Minimum:
42.135
jan 1, 2001
Maximum:
51.449
jan 1, 2013
At the date of observation
Value
Absolute change
Change from the previous value
jan 1, 2001
42.135
+42.135
0.0%
jan 1, 2013
51.449
+9.314
22.1%
Ranking of countries by current statistics by years