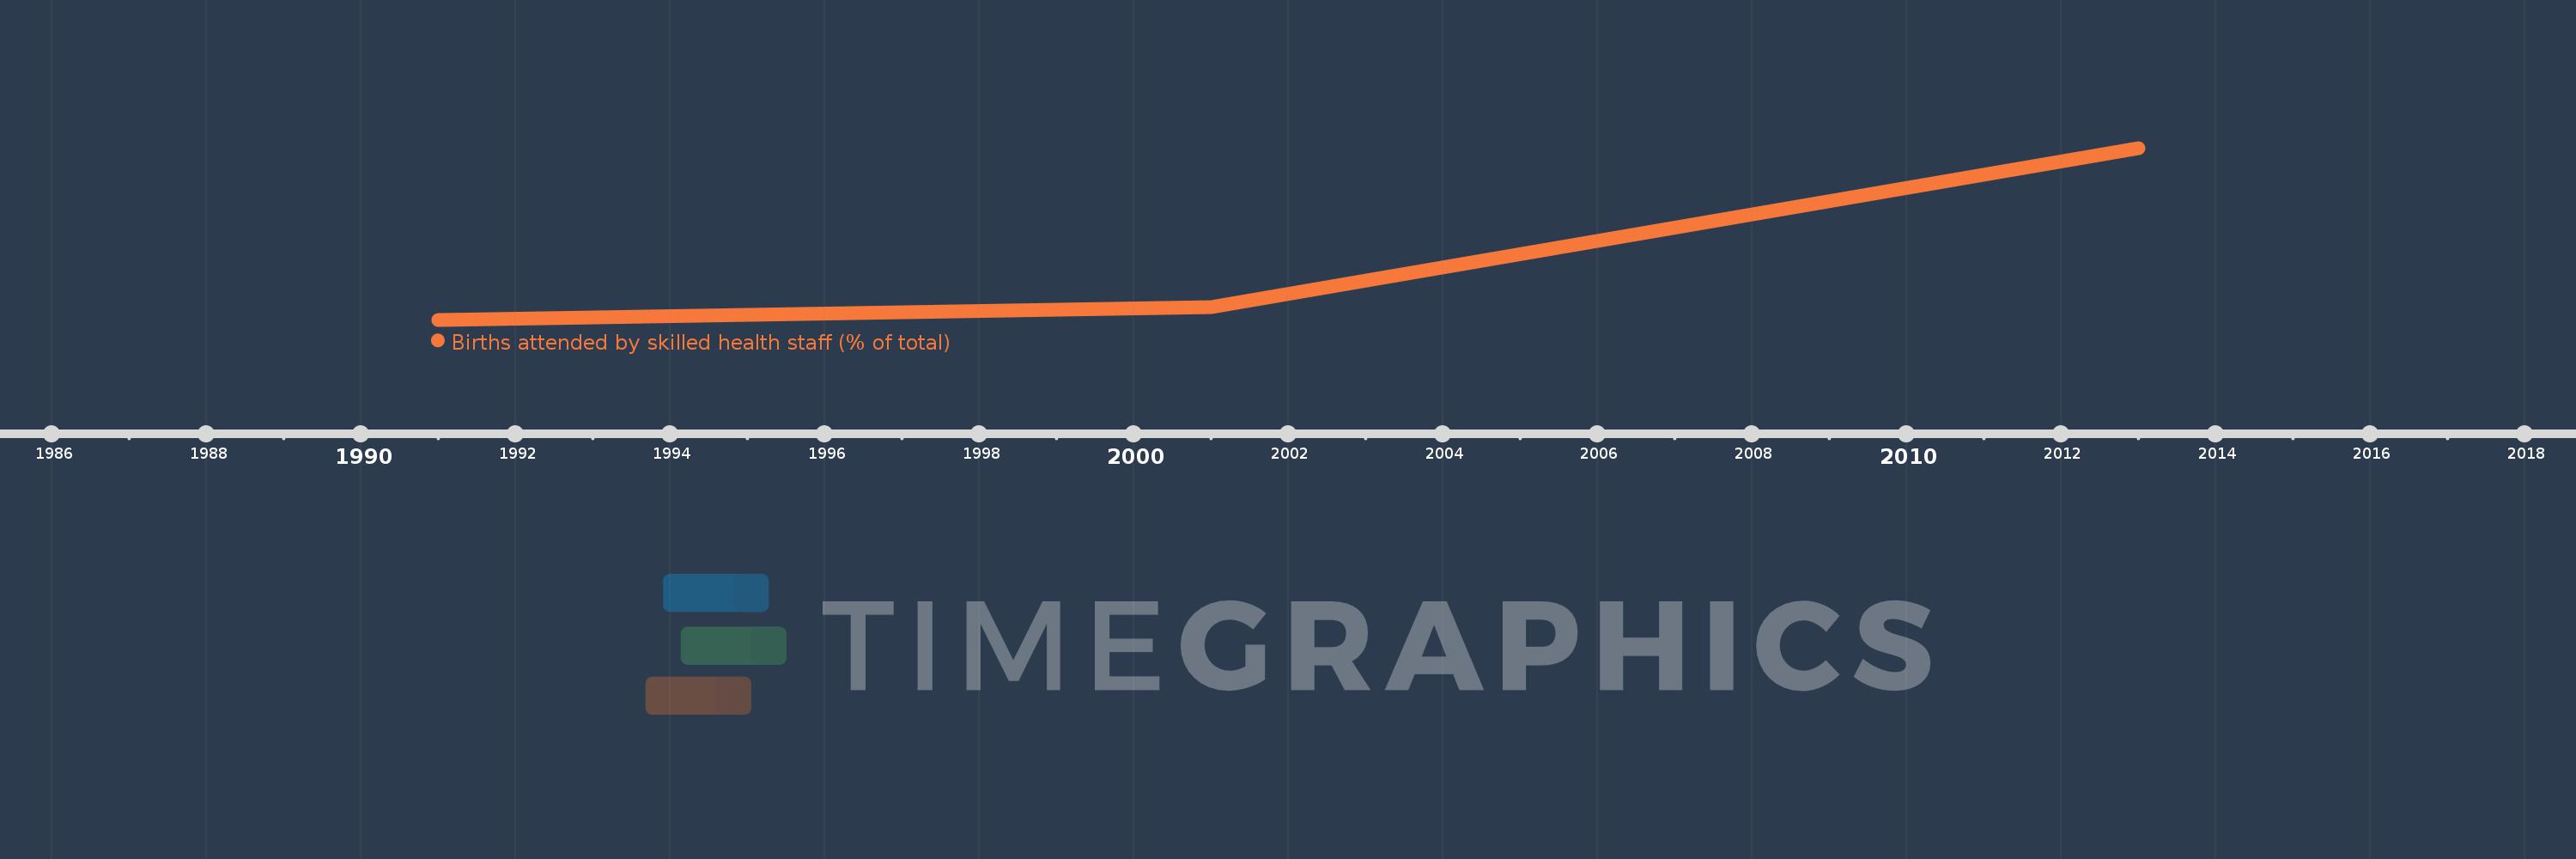
This timeline shows a graph from 1991 to 2013 of East Asia & Pacific (IDA & IBRD countries). No data until 1990. Number of actual observations by date: 3.
Source name:
World Development Indicators
Source organization:
UNICEF, State of the World's Children, Childinfo, and Demographic and Health Surveys.
Categories, topics:
Health, Gender
Last updated:
apr 23, 2017
Indicators value changes by year
Meaning:
87.05
Minimum:
83.935
jan 1, 1991
Maximum:
92.639
jan 1, 2013
At the date of observation
Value
Absolute change
Change from the previous value
jan 1, 1991
83.935
+83.935
0.0%
jan 1, 2001
84.575
+0.64
0.76%
jan 1, 2013
92.639
+8.063
9.53%
Ranking of countries by current statistics by years