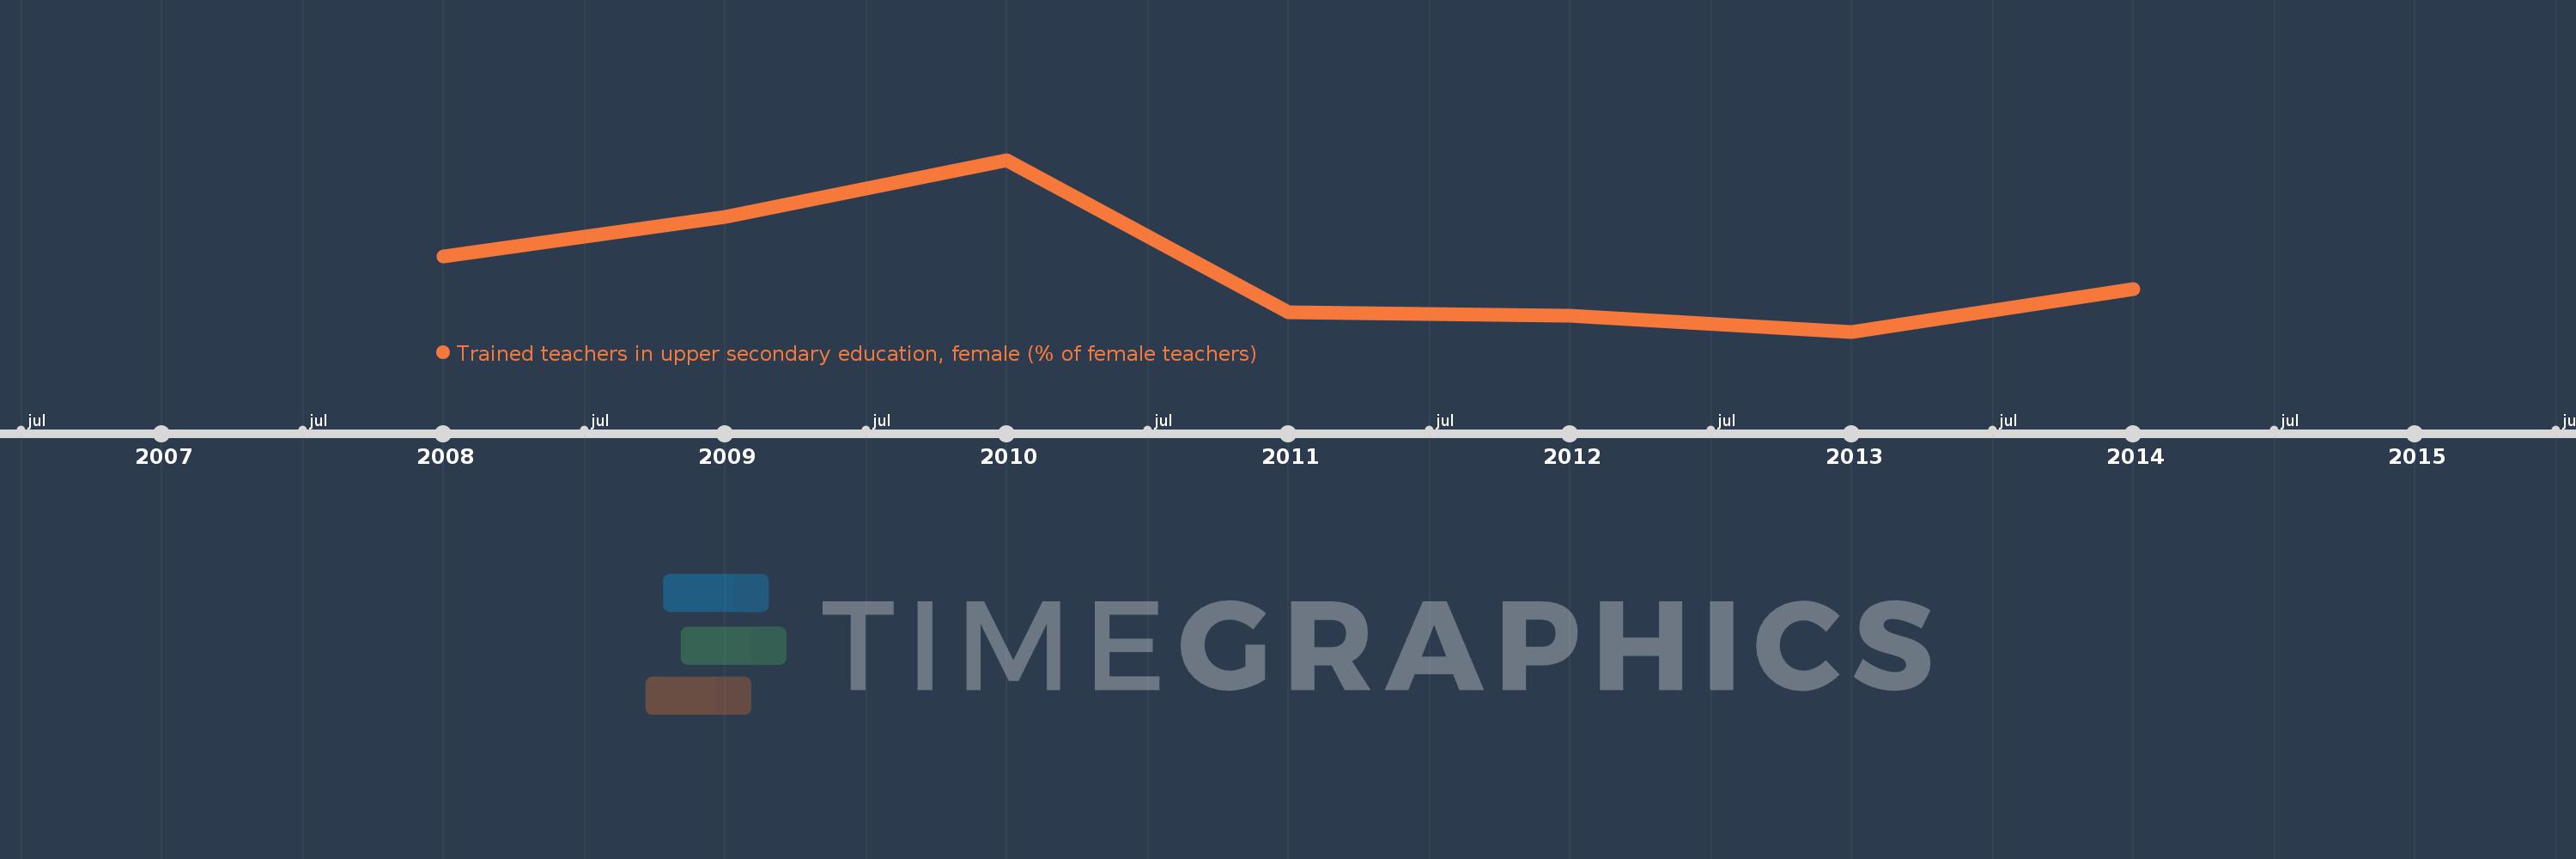
This timeline shows a graph from 2008 to 2014 of Sub-Saharan Africa (excluding high income). No data until 2007. Number of actual observations by date: 7.
Source name:
World Development Indicators
Source organization:
United Nations Educational, Scientific, and Cultural Organization (UNESCO) Institute for Statistics.
Categories, topics:
Education
Last updated:
apr 23, 2017
Indicators value changes by year
Meaning:
62.891
Minimum:
53.81
jan 1, 2013
Maximum:
78.663
jan 1, 2010
At the date of observation
Value
Absolute change
Change from the previous value
jan 1, 2008
64.714
+64.714
0.0%
jan 1, 2009
70.399
+5.685
8.79%
jan 1, 2010
78.663
+8.263
11.74%
jan 1, 2011
56.615
-22.047
-28.03%
jan 1, 2012
56.047
-0.568
-1.0%
jan 1, 2013
53.81
-2.237
-3.99%
jan 1, 2014
59.989
+6.179
11.48%
Ranking of countries by current statistics by years