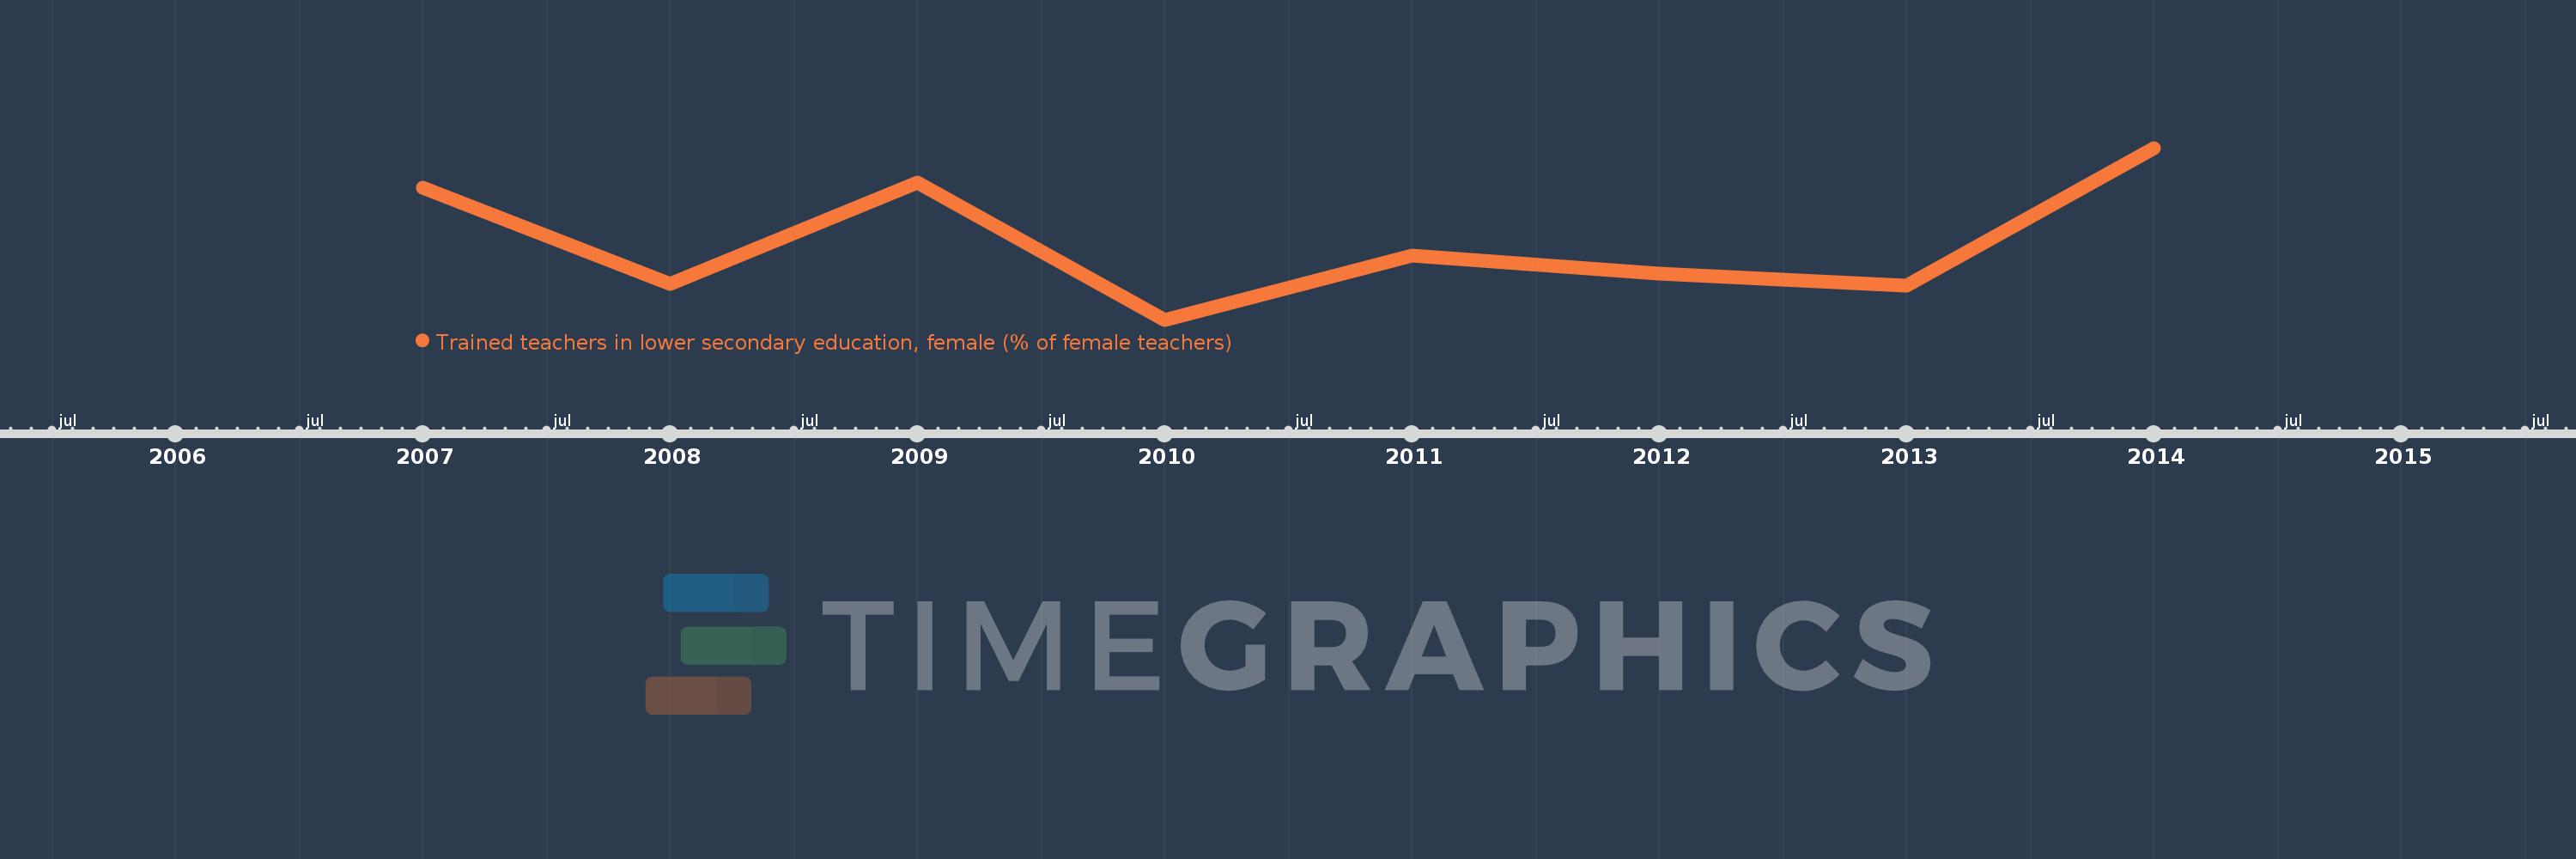
This timeline shows a graph from 2007 to 2014 of Sub-Saharan Africa (excluding high income). No data until 2006. Number of actual observations by date: 8.
Source name:
World Development Indicators
Source organization:
United Nations Educational, Scientific, and Cultural Organization (UNESCO) Institute for Statistics.
Categories, topics:
Education
Last updated:
apr 23, 2017
Indicators value changes by year
Meaning:
72.689
Minimum:
64.567
jan 1, 2010
Maximum:
82.574
jan 1, 2014
At the date of observation
Value
Absolute change
Change from the previous value
jan 1, 2007
78.361
+78.361
0.0%
jan 1, 2008
68.315
-10.046
-12.82%
jan 1, 2009
78.916
+10.601
15.52%
jan 1, 2010
64.567
-14.349
-18.18%
jan 1, 2011
71.274
+6.707
10.39%
jan 1, 2012
69.382
-1.892
-2.65%
jan 1, 2013
68.124
-1.257
-1.81%
jan 1, 2014
82.574
+14.449
21.21%
Ranking of countries by current statistics by years