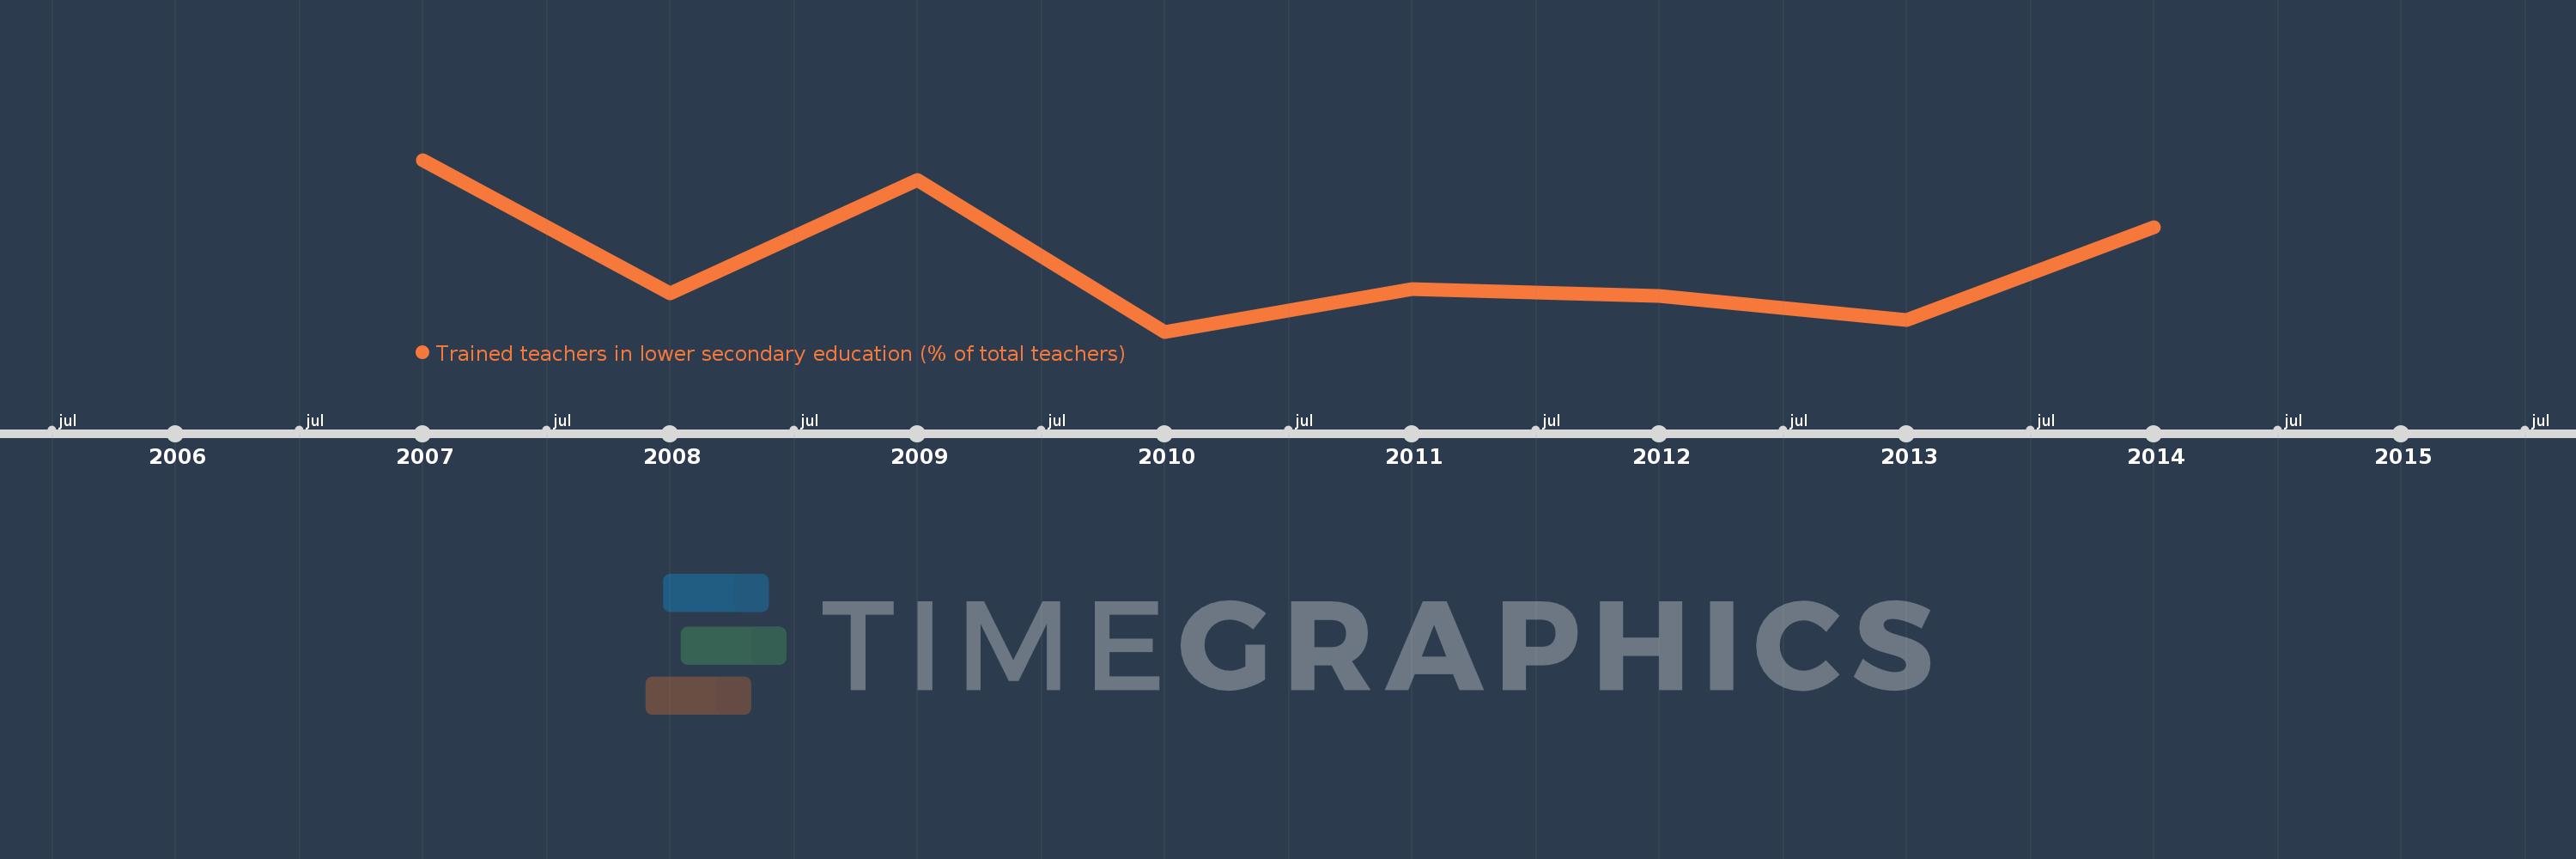
This timeline shows a graph from 2007 to 2014 of Sub-Saharan Africa (excluding high income). No data until 2006. Number of actual observations by date: 8.
Source name:
World Development Indicators
Source organization:
United Nations Educational, Scientific, and Cultural Organization (UNESCO) Institute for Statistics.
Categories, topics:
Education
Last updated:
apr 23, 2017
Indicators value changes by year
Meaning:
65.565
Minimum:
61.285
jan 1, 2010
Maximum:
71.863
jan 1, 2007
At the date of observation
Value
Absolute change
Change from the previous value
jan 1, 2007
71.863
+71.863
0.0%
jan 1, 2008
63.641
-8.223
-11.44%
jan 1, 2009
70.623
+6.983
10.97%
jan 1, 2010
61.285
-9.338
-13.22%
jan 1, 2011
63.881
+2.596
4.24%
jan 1, 2012
63.496
-0.386
-0.6%
jan 1, 2013
61.999
-1.496
-2.36%
jan 1, 2014
67.728
+5.729
9.24%
Ranking of countries by current statistics by years