33
/
AIzaSyB4mHJ5NPEv-XzF7P6NDYXjlkCWaeKw5bc
November 30, 2025
204828
Myanmar
MMR
true
2
1
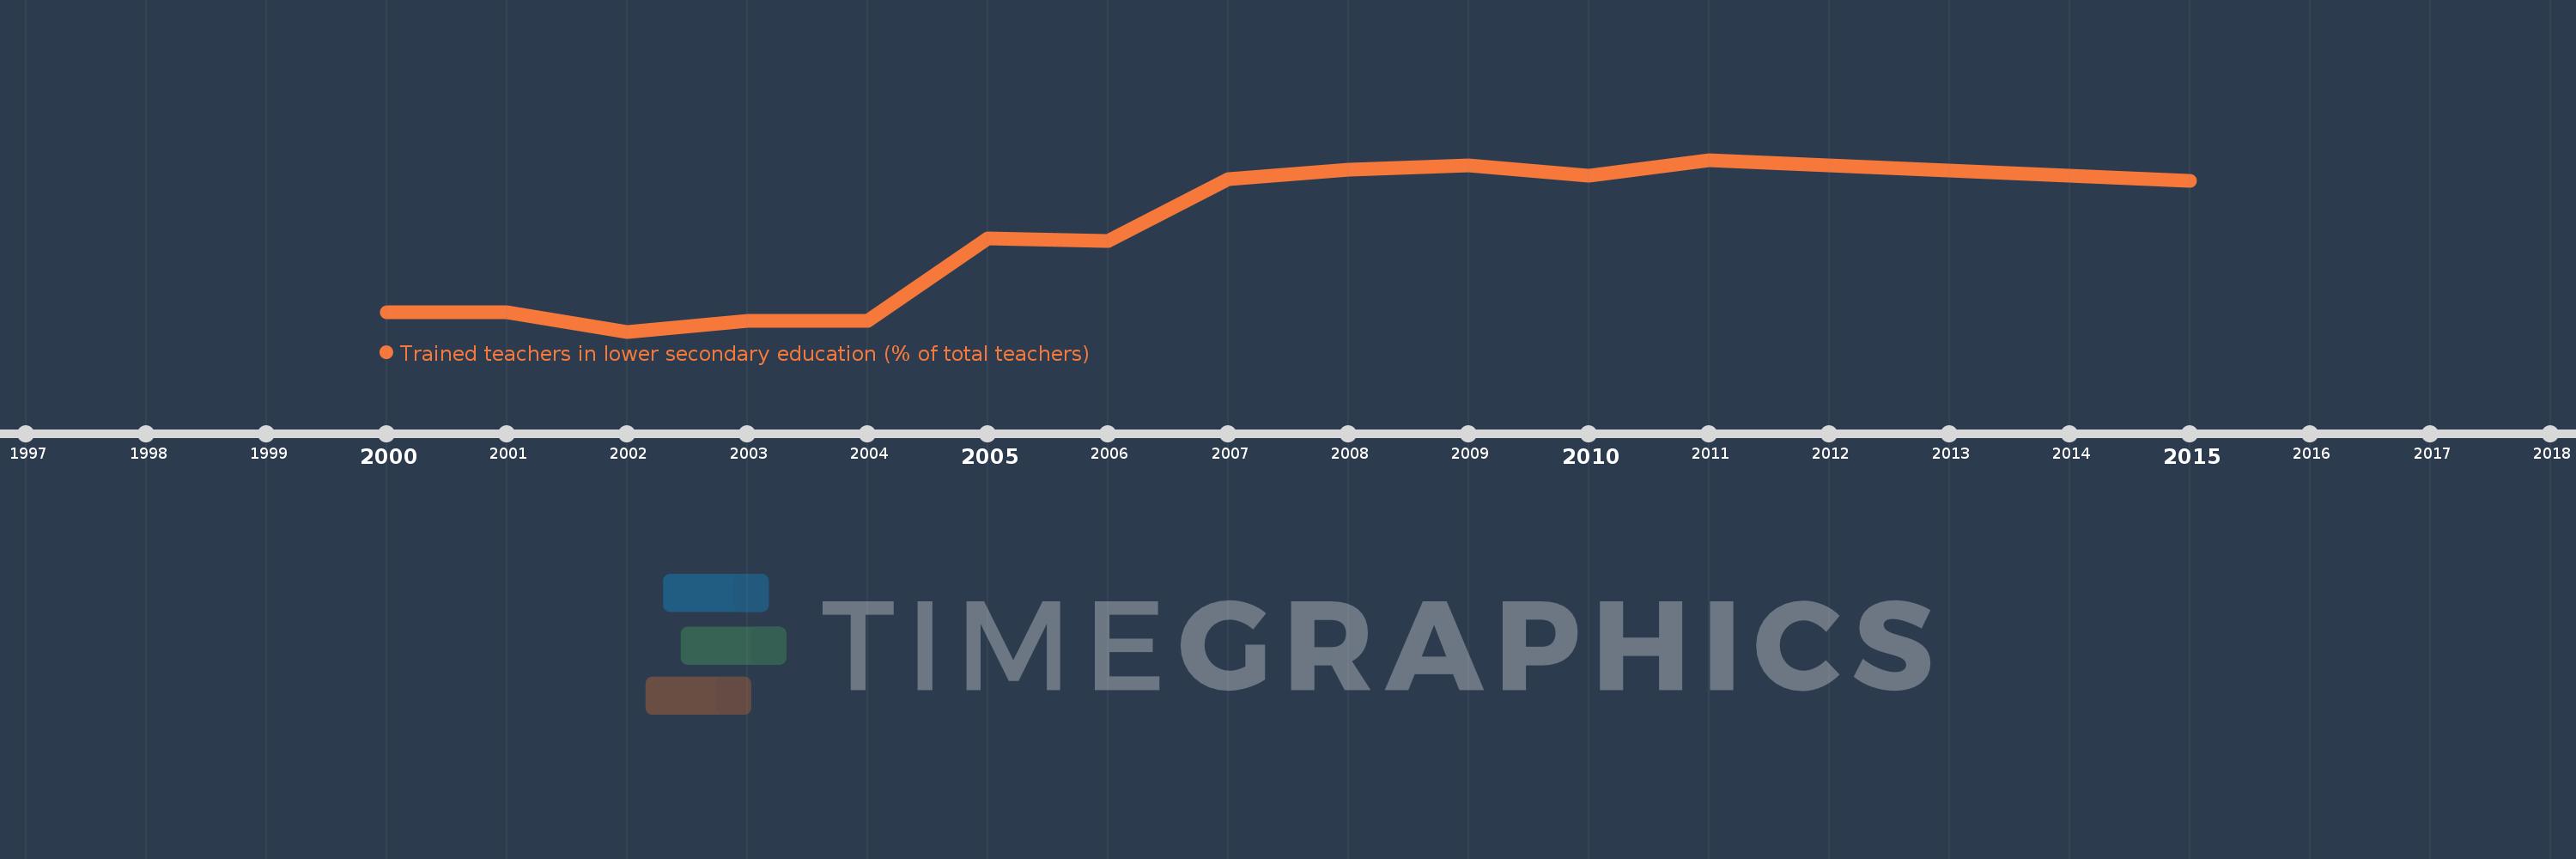
Trained teachers in lower secondary education (% of total teachers)
2015,2011,2010,2009,2008,2007,2006,2005,2004,2003,2002,2001,2000
Create a timeline
Public Timelines
For education
For educational institutions
For teachers
For students
Cabinet
For educational institutions
For teachers
For students
Open cabinet
FAQ
Close
Create a timeline
Public timelines
FAQ
About & Feedback
Terms
Privacy
FAQ
Support 24/7
Cabinet
Get premium
Donate
Download
Global statistics library
→
Myanmar
→
Trained teachers in lower secondary education (% of total teachers)
This statistics in other country:
Andorra
Antigua and Barbuda
Arab World
Bahamas, The
Bahrain
Bangladesh
Belarus
Belize
Benin
Bermuda
Bhutan
British Virgin Islands
Brunei Darussalam
Burkina Faso
Burundi
Cabo Verde
Cambodia
Cameroon
Caribbean small states
Cayman Islands
Colombia
Comoros
Congo, Rep.
Costa Rica
Croatia
Cuba
Djibouti
Dominica
Dominican Republic
Ecuador
Egypt, Arab Rep.
El Salvador
Eritrea
Ethiopia
Fiji
Gambia, The
Georgia
Ghana
Gibraltar
Grenada
Guinea
Guyana
Heavily indebted poor countries (HIPC)
Honduras
IDA blend
IDA only
IDA total
Iran, Islamic Rep.
Iraq
Kenya
Kiribati
Kuwait
Lao PDR
Latin America & Caribbean
Latin America & Caribbean (excluding high income)
Latin America & the Caribbean (IDA & IBRD countries)
Least developed countries: UN classification
Lebanon
Liberia
Low income
Macao SAR, China
Madagascar
Maldives
Mali
Mauritania
Mexico
Middle East & North Africa
Middle East & North Africa (excluding high income)
Middle East & North Africa (IDA & IBRD countries)
Mongolia
Mozambique
Myanmar
Nepal
Nicaragua
Niger
Nigeria
Oman
Pacific island small states
Panama
Paraguay
Pre-demographic dividend
Qatar
Sao Tome and Principe
Saudi Arabia
Serbia
Sierra Leone
Singapore
Solomon Islands
South Sudan
Sri Lanka
St. Kitts and Nevis
St. Lucia
St. Vincent and the Grenadines
Sub-Saharan Africa
Sub-Saharan Africa (excluding high income)
Sub-Saharan Africa (IDA & IBRD countries)
Suriname
Tajikistan
Tonga
Trinidad and Tobago
Turks and Caicos Islands
United Arab Emirates
Vanuatu
Vietnam
West Bank and Gaza
Zambia
Timeline:
This timeline shows a graph from
2000
to
2015
of Myanmar. No data until
1999
. Number of actual observations by date:
13
.
Source name:
World Development Indicators
Source organization:
United Nations Educational, Scientific, and Cultural Organization (UNESCO) Institute for Statistics.
Categories, topics:
Education
Last updated:
apr 23, 2017
Indicators value changes by year
Meaning:
79.486
Minimum:
57.5
jan 1, 2002
Maximum:
98.349
jan 1, 2011
At the date of observation
Value
Absolute change
Change from the previous value
jan 1, 2000
62.098
+62.098
0.0%
jan 1, 2001
62.099
+0.001
0.0%
jan 1, 2002
57.5
-4.599
-7.41%
jan 1, 2003
59.999
+2.499
4.35%
jan 1, 2004
59.999
+0.001
0.0%
jan 1, 2005
79.7
+19.701
32.84%
jan 1, 2006
79.001
-0.7
-0.88%
jan 1, 2007
93.81
+14.809
18.75%
jan 1, 2008
96.001
+2.191
2.34%
jan 1, 2009
97.0
+1.0
1.04%
jan 1, 2010
94.519
-2.481
-2.56%
jan 1, 2011
98.349
+3.83
4.05%
jan 1, 2015
93.249
-5.1
-5.19%
Ranking of countries by current statistics by years
About & Feedback
Terms
Privacy
FAQ
Support 24/7
Cabinet
Get premium
Donate
The service accepts bank transfer (ACH, Wire) or cards (Visa, MasterCard, etc). Processed by Stripe.
Secured with SSL