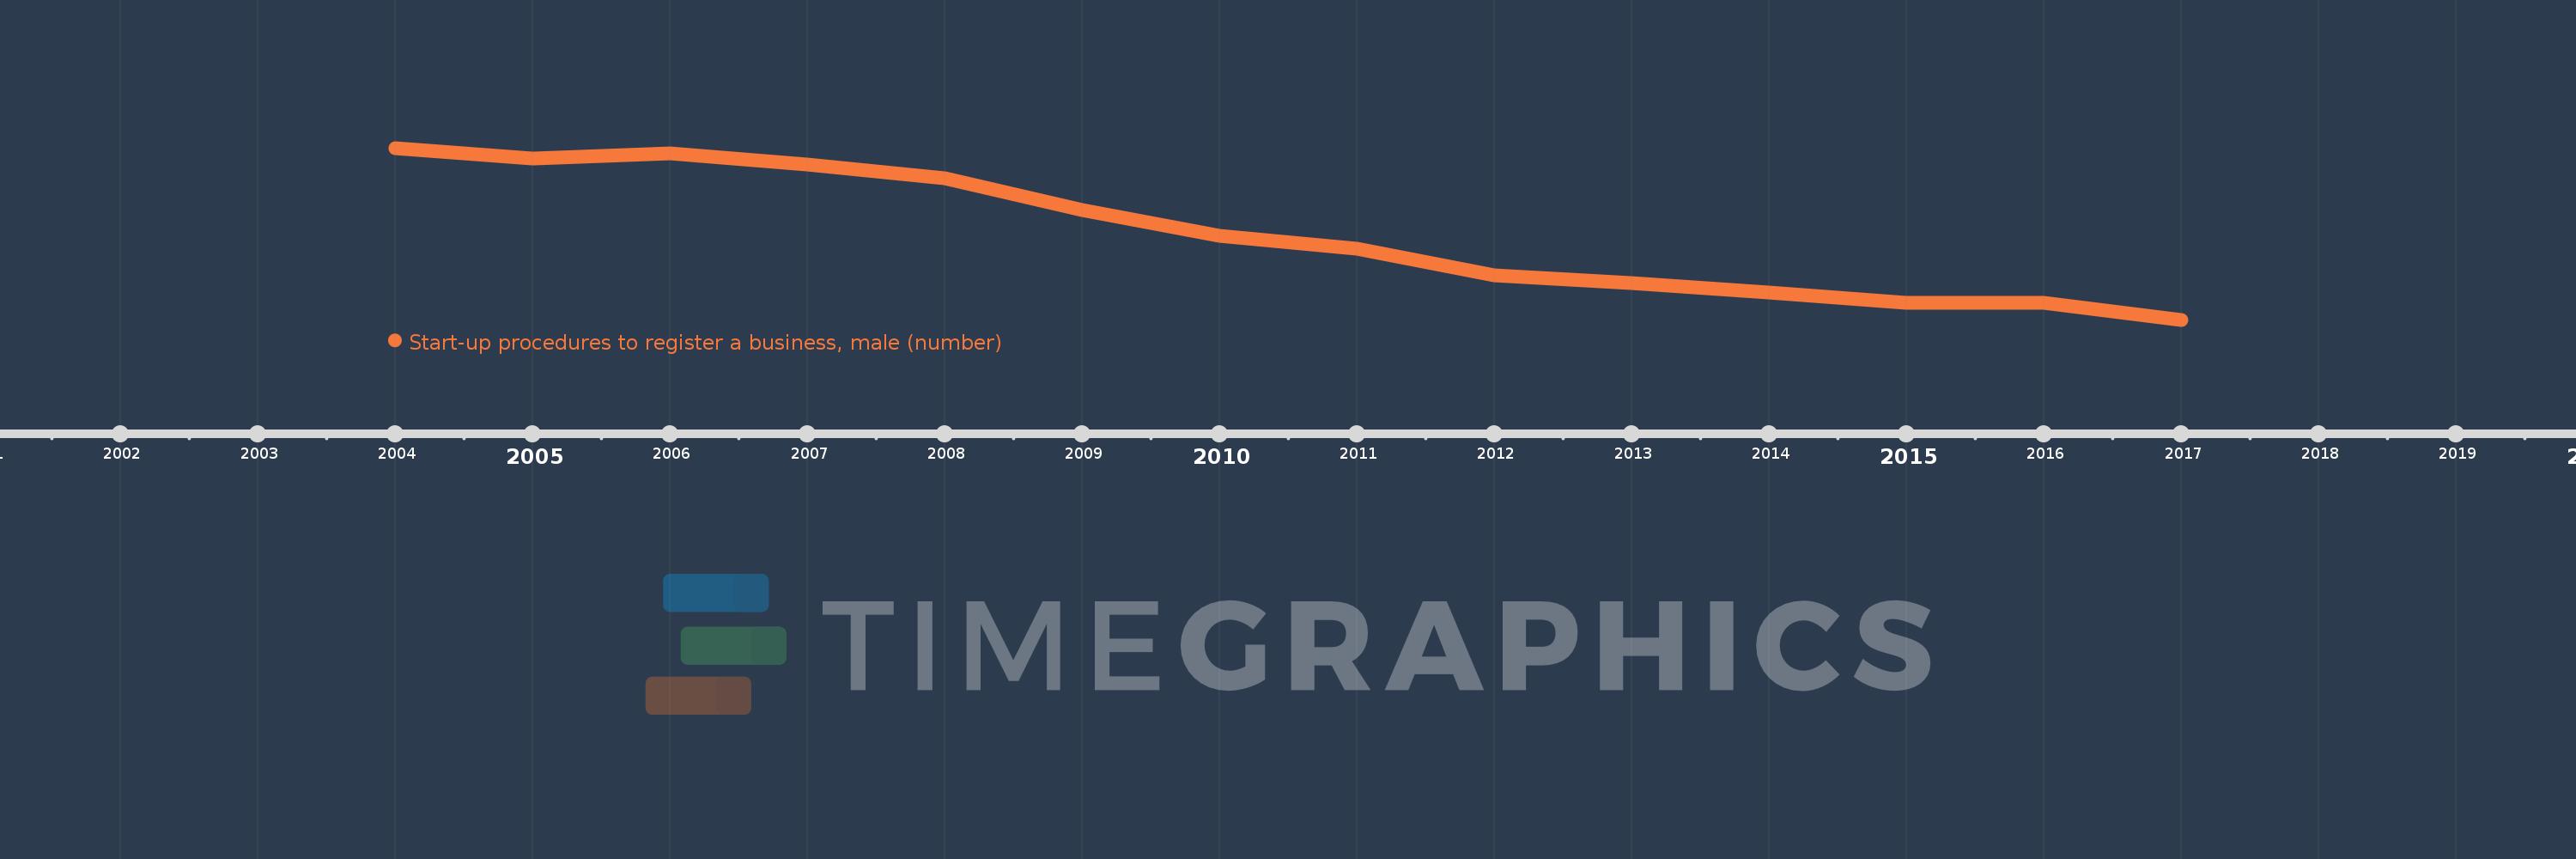
This timeline shows a graph from 2004 to 2017 of Sub-Saharan Africa (excluding high income). No data until 2003. Number of actual observations by date: 14.
Source name:
World Development Indicators
Source organization:
World Bank, Doing Business project (http://www.doingbusiness.org/).
Categories, topics:
Private Sector
Last updated:
apr 23, 2017
Indicators value changes by year
Meaning:
9.502
Minimum:
7.76
jan 1, 2017
Maximum:
11.242
jan 1, 2004
At the date of observation
Value
Absolute change
Change from the previous value
jan 1, 2004
11.242
+11.242
0.0%
jan 1, 2005
11.027
-0.215
-1.92%
jan 1, 2006
11.136
+0.109
0.99%
jan 1, 2007
10.911
-0.225
-2.02%
jan 1, 2008
10.622
-0.289
-2.65%
jan 1, 2009
9.978
-0.644
-6.07%
jan 1, 2010
9.467
-0.511
-5.12%
jan 1, 2011
9.2
-0.267
-2.82%
jan 1, 2012
8.667
-0.533
-5.8%
jan 1, 2013
8.5
-0.167
-1.92%
jan 1, 2014
8.32
-0.18
-2.12%
jan 1, 2015
8.102
-0.217
-2.61%
jan 1, 2016
8.1
-0.002
-0.03%
jan 1, 2017
7.76
-0.34
-4.2%
Ranking of countries by current statistics by years