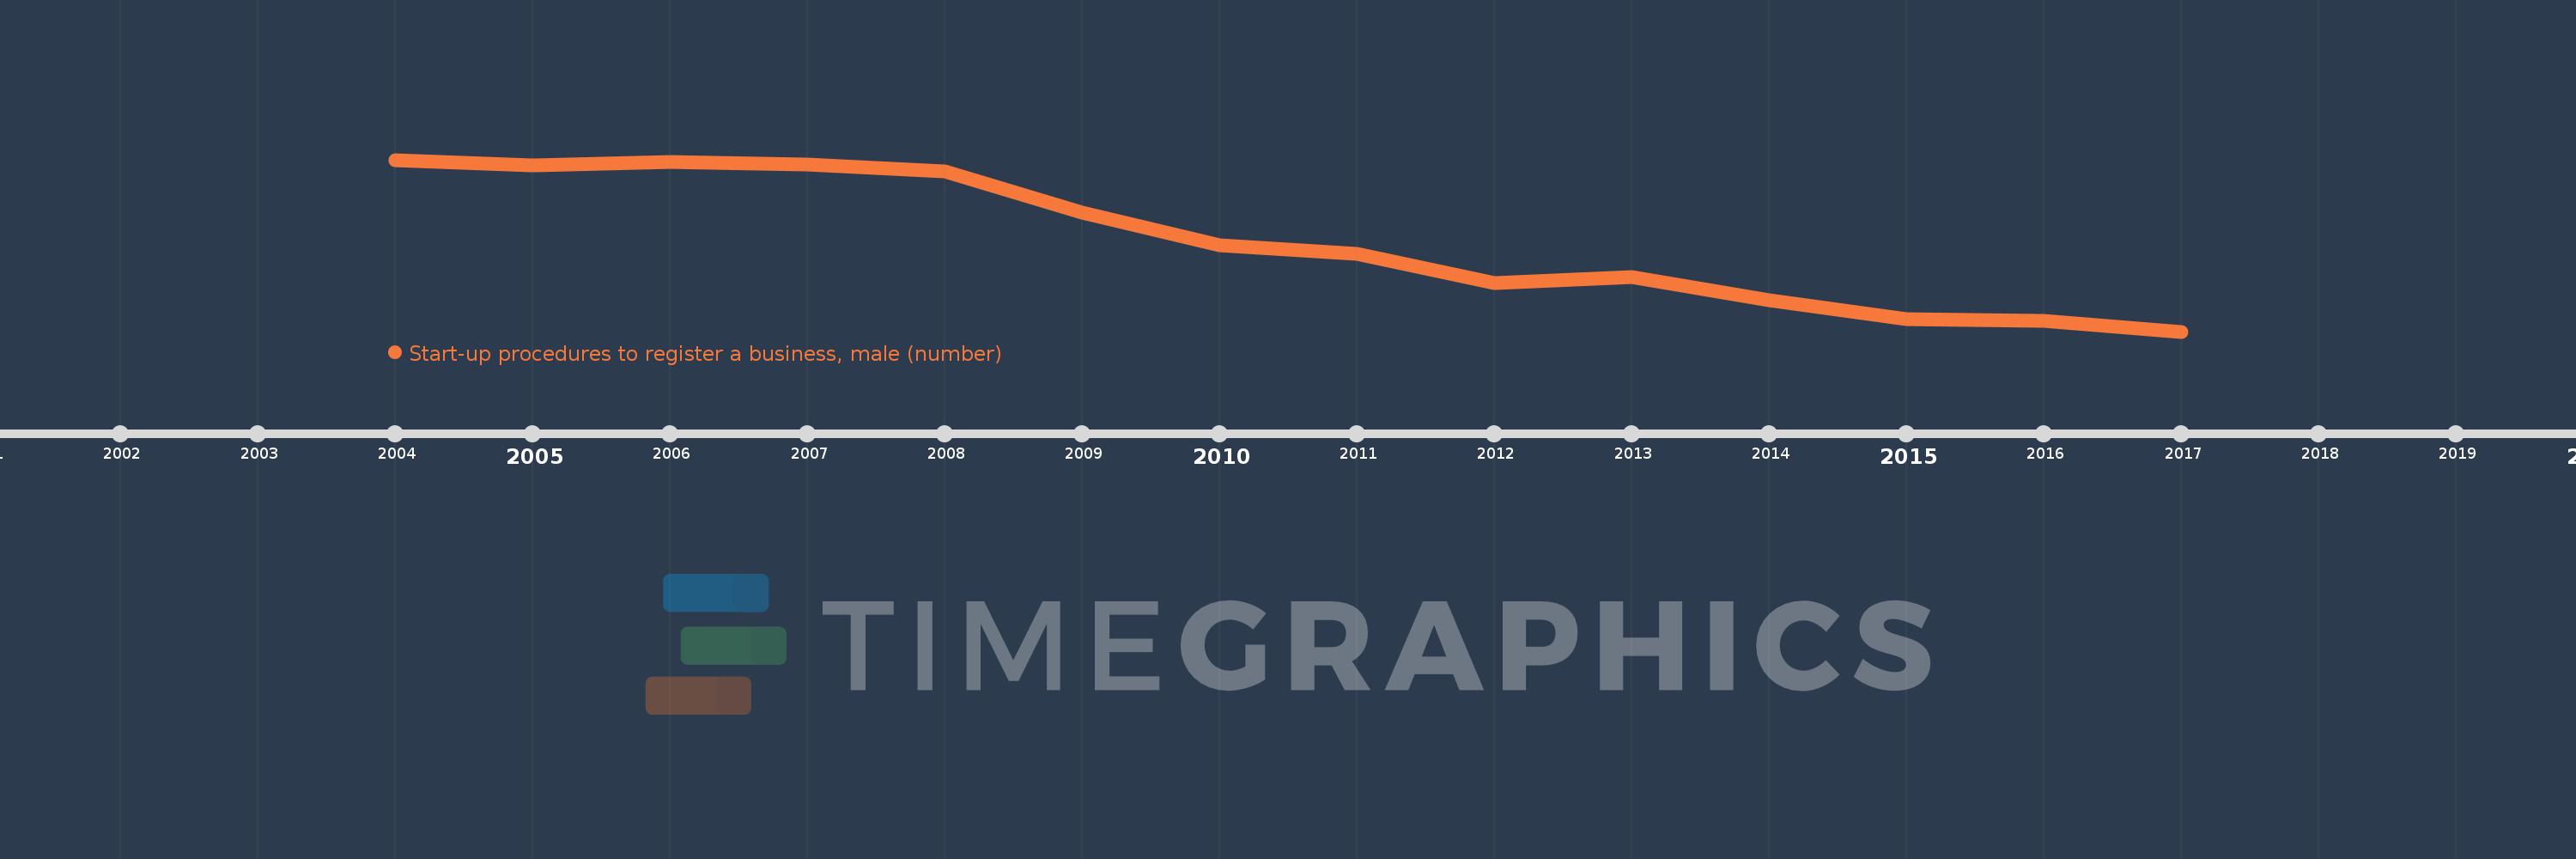
This timeline shows a graph from 2004 to 2017 of Fragile and conflict affected situations. No data until 2003. Number of actual observations by date: 14.
Source name:
World Development Indicators
Source organization:
World Bank, Doing Business project (http://www.doingbusiness.org/).
Categories, topics:
Private Sector
Last updated:
apr 23, 2017
Indicators value changes by year
Meaning:
8.941
Minimum:
7.5
jan 1, 2017
Maximum:
10.211
jan 1, 2004
At the date of observation
Value
Absolute change
Change from the previous value
jan 1, 2004
10.211
+10.211
0.0%
jan 1, 2005
10.125
-0.086
-0.84%
jan 1, 2006
10.179
+0.054
0.53%
jan 1, 2007
10.138
-0.041
-0.4%
jan 1, 2008
10.034
-0.103
-1.02%
jan 1, 2009
9.379
-0.655
-6.53%
jan 1, 2010
8.867
-0.513
-5.47%
jan 1, 2011
8.733
-0.133
-1.5%
jan 1, 2012
8.267
-0.467
-5.34%
jan 1, 2013
8.364
+0.097
1.17%
jan 1, 2014
8.0
-0.364
-4.35%
jan 1, 2015
7.697
-0.303
-3.79%
jan 1, 2016
7.676
-0.02
-0.27%
jan 1, 2017
7.5
-0.176
-2.3%
Ranking of countries by current statistics by years