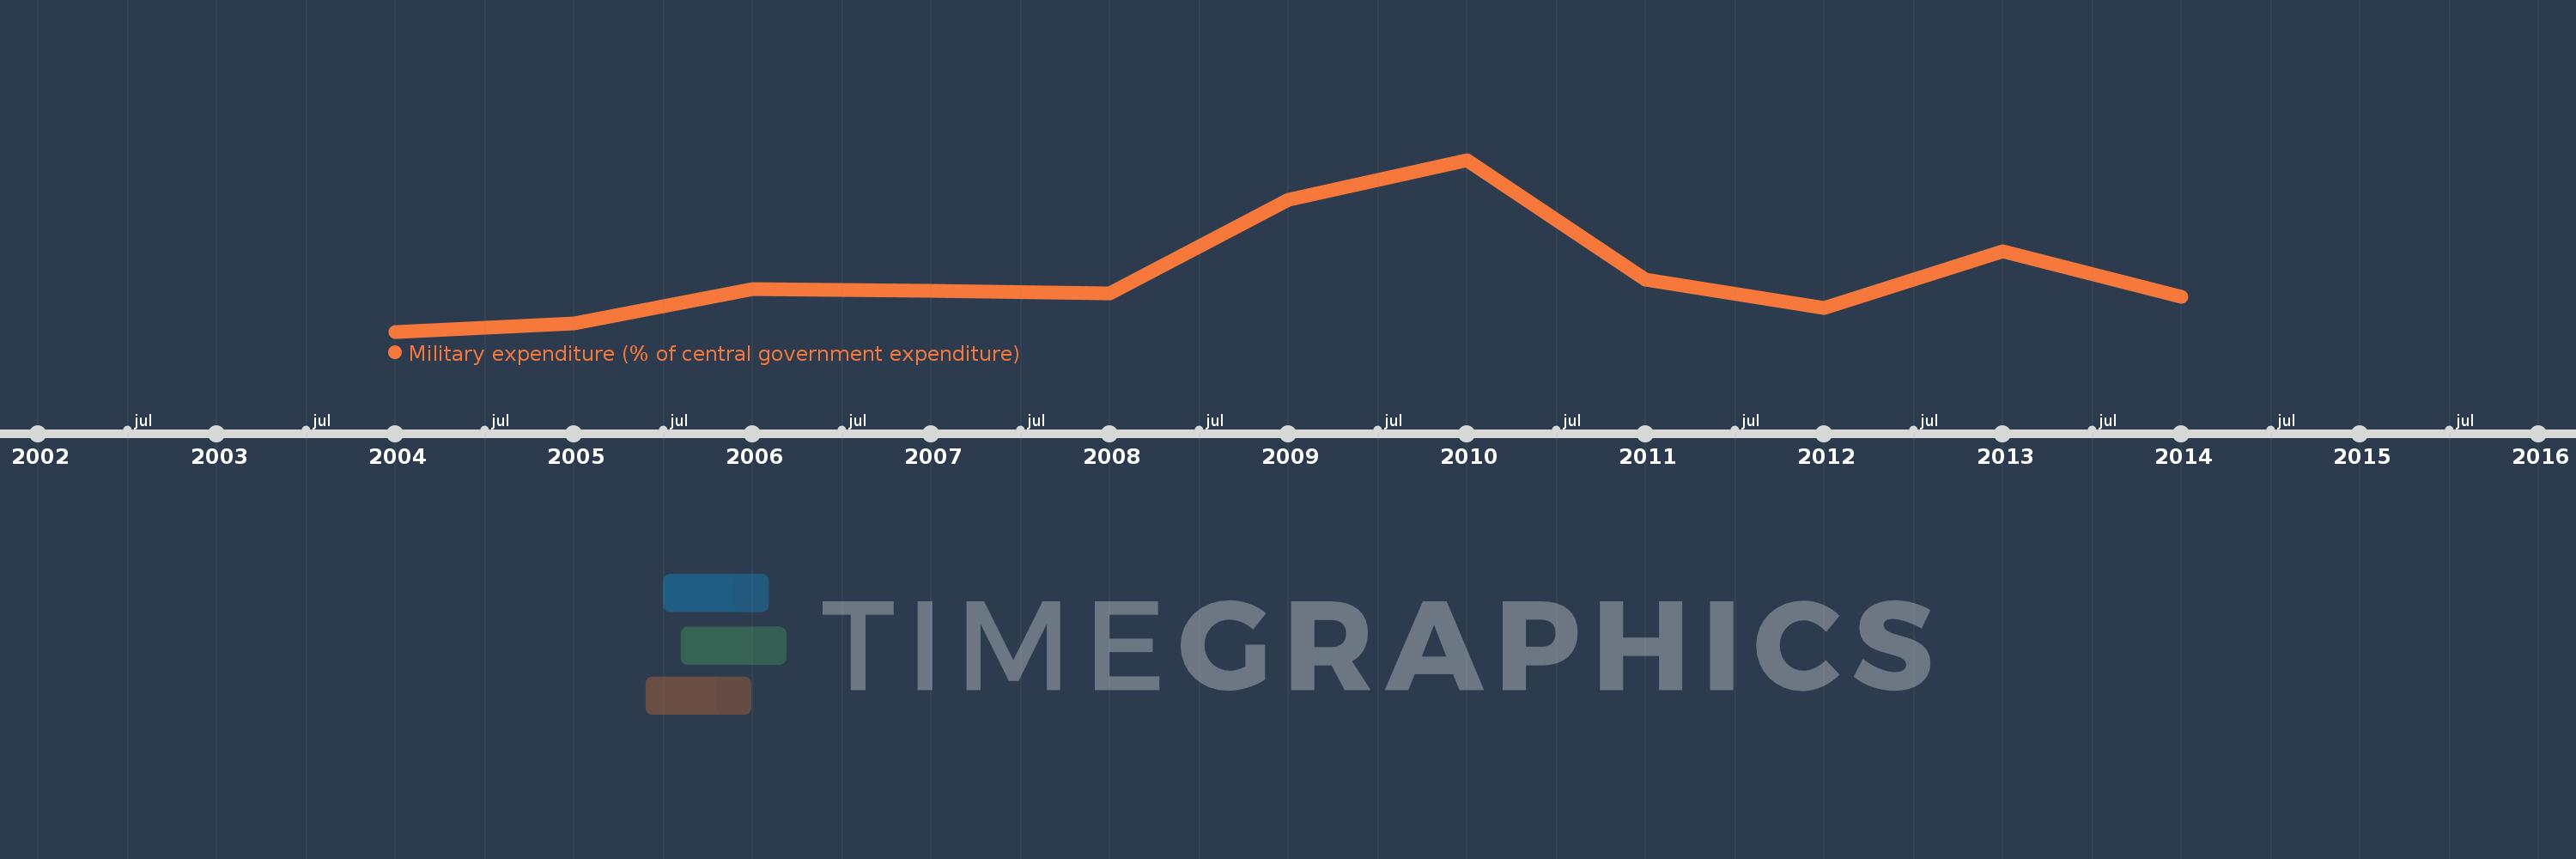
This timeline shows a graph from 2004 to 2014 of Sub-Saharan Africa (excluding high income). No data until 2003. Number of actual observations by date: 11.
Source name:
World Development Indicators
Source organization:
Stockholm International Peace Research Institute (SIPRI), Yearbook: Armaments, Disarmament and International Security.
Categories, topics:
Public Sector
Last updated:
apr 23, 2017
Indicators value changes by year
Meaning:
7.327
Minimum:
6.968
jan 1, 2004
Maximum:
8.055
jan 1, 2010
At the date of observation
Value
Absolute change
Change from the previous value
jan 1, 2004
6.968
+6.968
0.0%
jan 1, 2005
7.019
+0.051
0.73%
jan 1, 2006
7.237
+0.218
3.1%
jan 1, 2007
7.228
-0.009
-0.12%
jan 1, 2008
7.212
-0.016
-0.23%
jan 1, 2009
7.801
+0.589
8.17%
jan 1, 2010
8.055
+0.254
3.25%
jan 1, 2011
7.297
-0.758
-9.41%
jan 1, 2012
7.118
-0.18
-2.46%
jan 1, 2013
7.474
+0.356
5.0%
jan 1, 2014
7.189
-0.284
-3.8%
Ranking of countries by current statistics by years