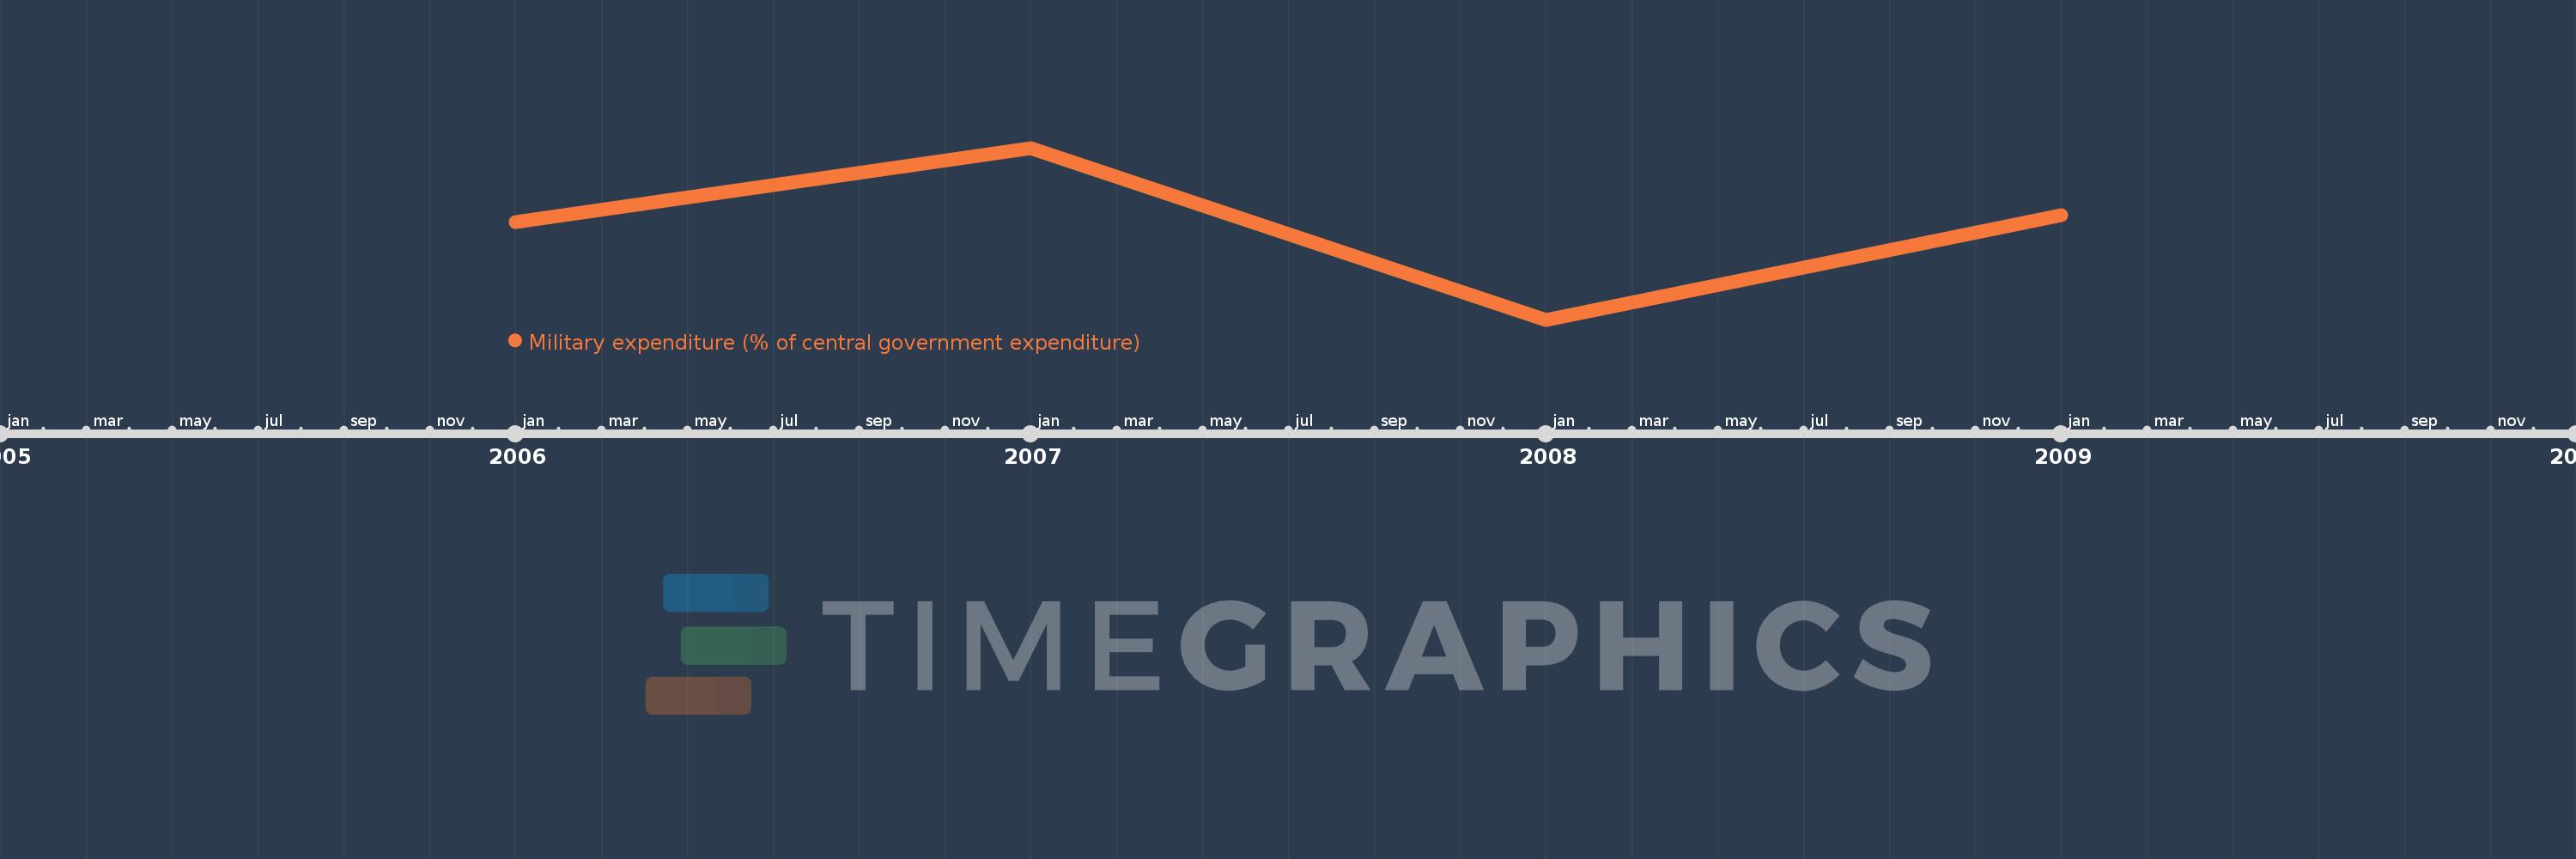
This timeline shows a graph from 2006 to 2009 of East Asia & Pacific (IDA & IBRD countries). No data until 2005. Number of actual observations by date: 4.
Source name:
World Development Indicators
Source organization:
Stockholm International Peace Research Institute (SIPRI), Yearbook: Armaments, Disarmament and International Security.
Categories, topics:
Public Sector
Last updated:
apr 23, 2017
Indicators value changes by year
Meaning:
14.187
Minimum:
11.321
jan 1, 2008
Maximum:
16.594
jan 1, 2007
At the date of observation
Value
Absolute change
Change from the previous value
jan 1, 2006
14.318
+14.318
0.0%
jan 1, 2007
16.594
+2.276
15.9%
jan 1, 2008
11.321
-5.273
-31.78%
jan 1, 2009
14.517
+3.196
28.23%
Ranking of countries by current statistics by years