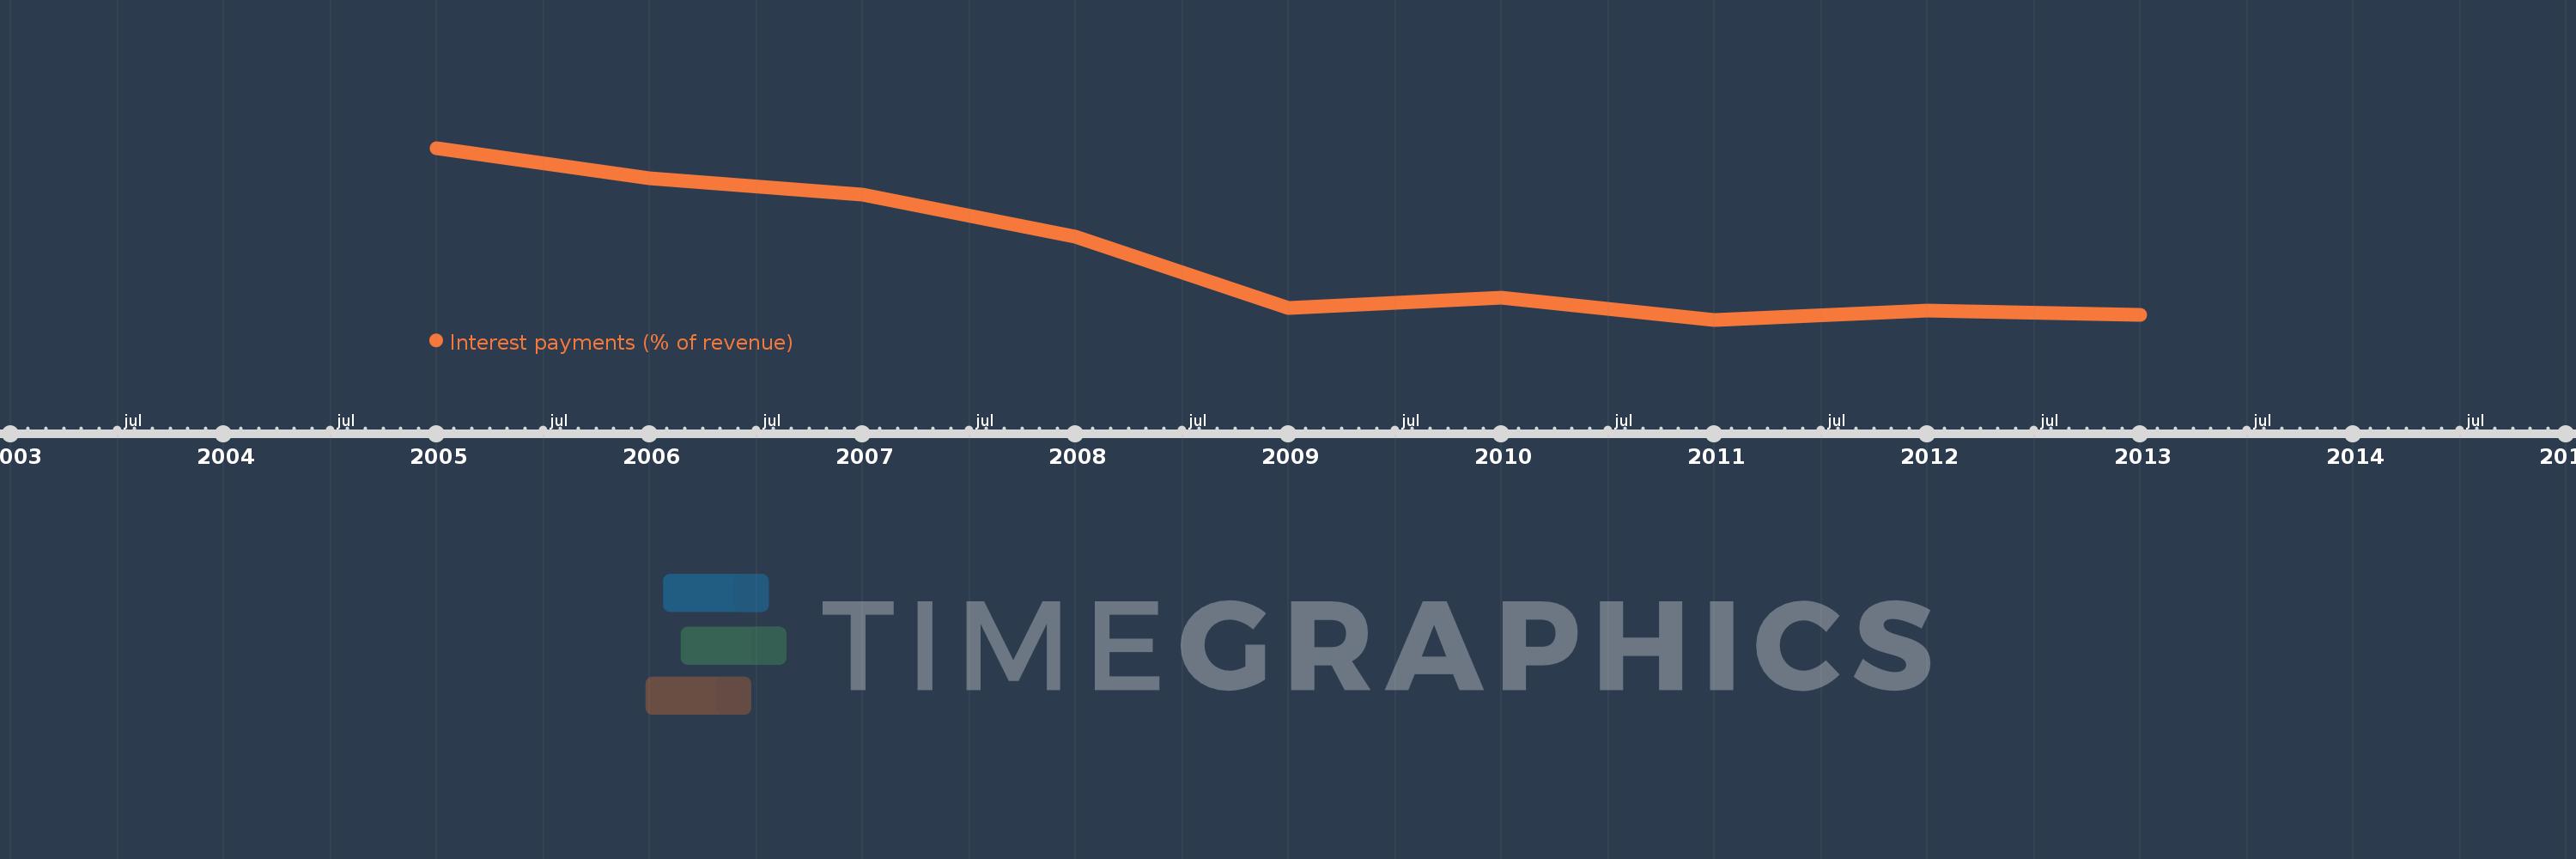
This timeline shows a graph from 2005 to 2013 of Sub-Saharan Africa (excluding high income). No data until 2004. Number of actual observations by date: 9.
Source name:
World Development Indicators
Source organization:
International Monetary Fund, Government Finance Statistics Yearbook and data files.
Categories, topics:
Public Sector
Last updated:
apr 23, 2017
Indicators value changes by year
Meaning:
6.108
Minimum:
4.393
jan 1, 2011
Maximum:
9.058
jan 1, 2005
At the date of observation
Value
Absolute change
Change from the previous value
jan 1, 2005
9.058
+9.058
0.0%
jan 1, 2006
8.229
-0.829
-9.15%
jan 1, 2007
7.788
-0.441
-5.36%
jan 1, 2008
6.647
-1.142
-14.66%
jan 1, 2009
4.716
-1.93
-29.04%
jan 1, 2010
4.984
+0.268
5.67%
jan 1, 2011
4.393
-0.591
-11.86%
jan 1, 2012
4.643
+0.25
5.69%
jan 1, 2013
4.517
-0.126
-2.72%
Ranking of countries by current statistics by years