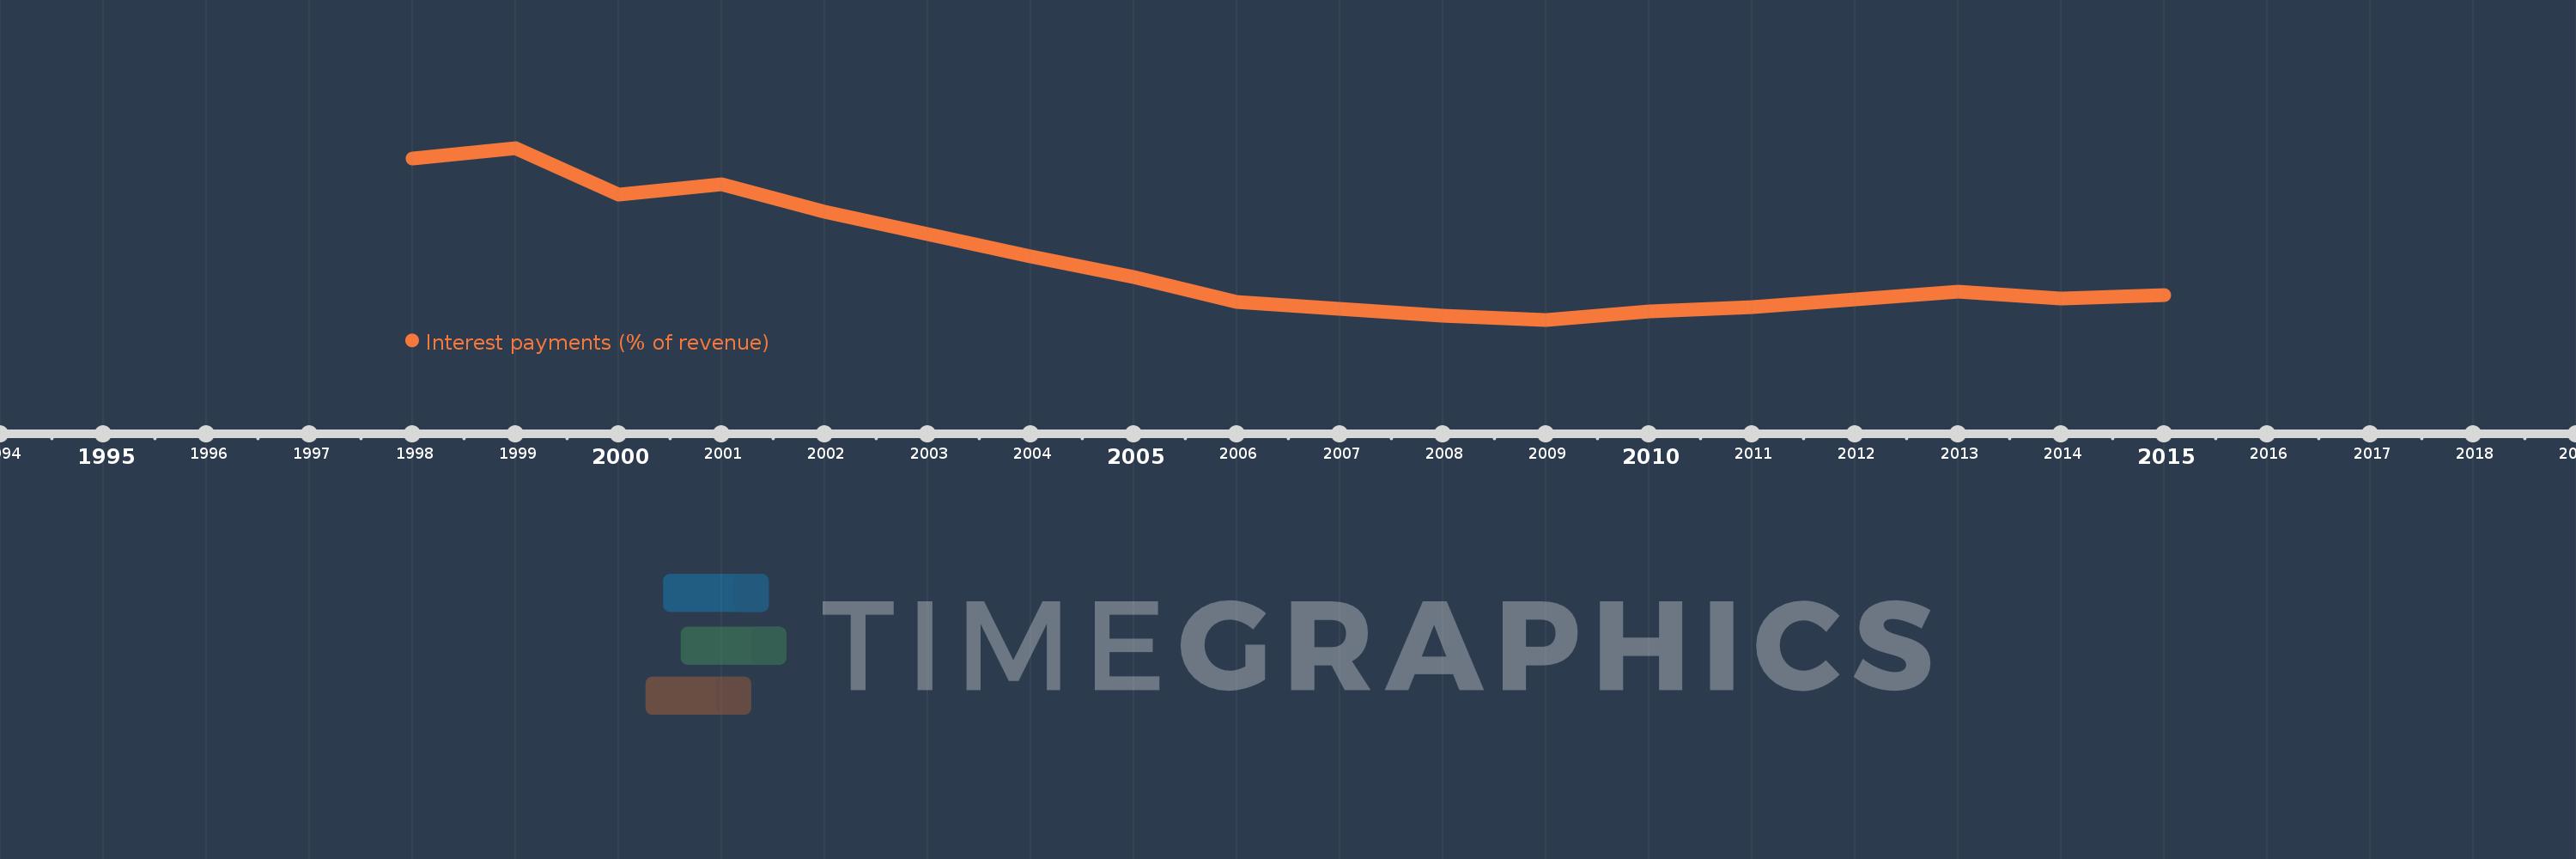
This timeline shows a graph from 1998 to 2015 of Europe & Central Asia (excluding high income). No data until 1997. Number of actual observations by date: 17.
Source name:
World Development Indicators
Source organization:
International Monetary Fund, Government Finance Statistics Yearbook and data files.
Categories, topics:
Public Sector
Last updated:
apr 23, 2017
Indicators value changes by year
Meaning:
5.419
Minimum:
1.619
jan 1, 2009
Maximum:
13.231
jan 1, 1999
At the date of observation
Value
Absolute change
Change from the previous value
jan 1, 1998
12.516
+12.516
0.0%
jan 1, 1999
13.231
+0.714
5.71%
jan 1, 2000
10.08
-3.151
-23.81%
jan 1, 2001
10.766
+0.686
6.8%
jan 1, 2002
8.944
-1.822
-16.92%
jan 1, 2004
5.885
-3.059
-34.21%
jan 1, 2005
4.518
-1.366
-23.22%
jan 1, 2006
2.84
-1.679
-37.16%
jan 1, 2007
2.342
-0.498
-17.53%
jan 1, 2008
1.864
-0.478
-20.4%
jan 1, 2009
1.619
-0.245
-13.15%
jan 1, 2010
2.206
+0.587
36.25%
jan 1, 2011
2.48
+0.275
12.45%
jan 1, 2012
2.972
+0.491
19.8%
jan 1, 2013
3.518
+0.546
18.38%
jan 1, 2014
3.071
-0.447
-12.7%
jan 1, 2015
3.28
+0.209
6.8%
Ranking of countries by current statistics by years