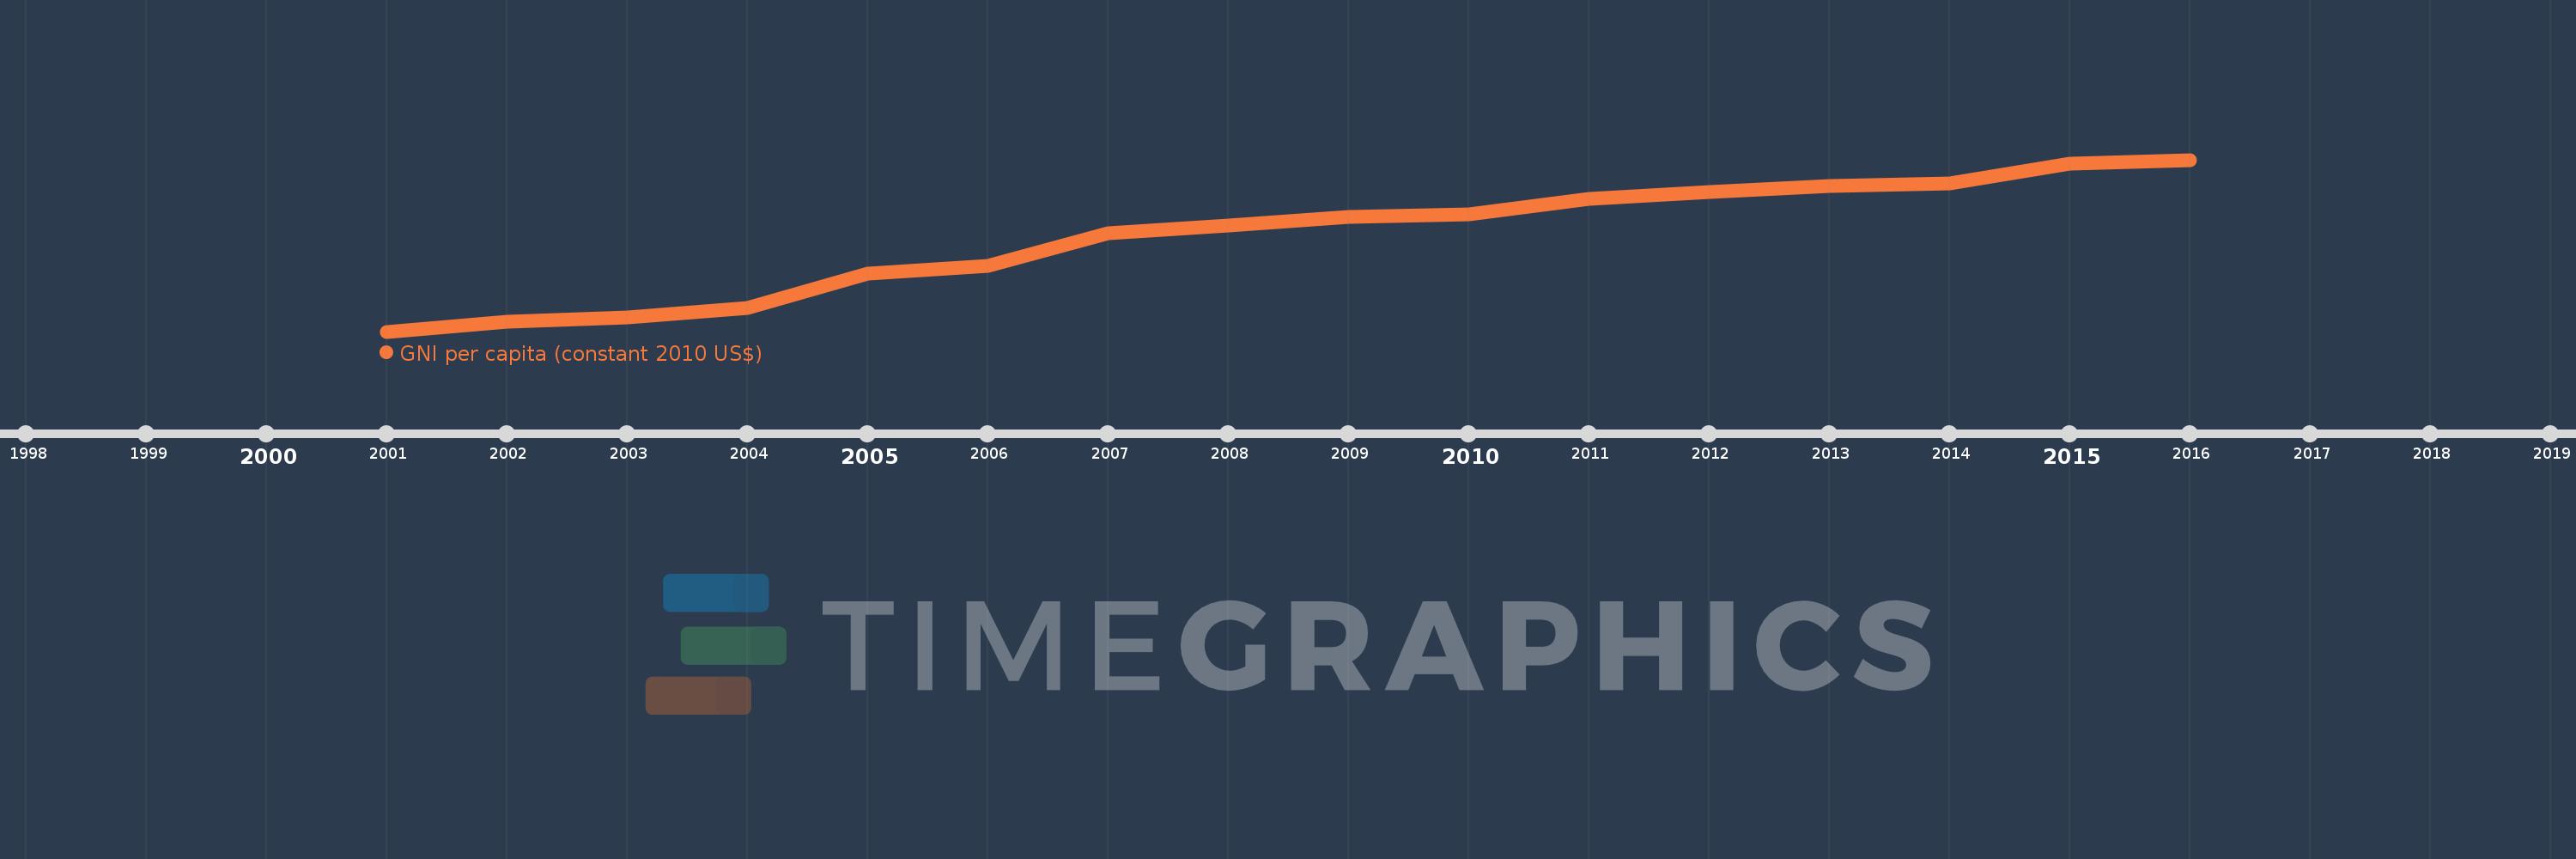
This timeline shows a graph from 2001 to 2016 of Sub-Saharan Africa (excluding high income). No data until 2000. Number of actual observations by date: 16.
Source name:
World Development Indicators
Source organization:
World Bank national accounts data, and OECD National Accounts data files.
Categories, topics:
Economy & Growth
Last updated:
apr 23, 2017
Indicators value changes by year
Meaning:
1.374K
Minimum:
1.11K
jan 1, 2001
Maximum:
1.59K
jan 1, 2016
At the date of observation
Value
Absolute change
Change from the previous value
jan 1, 2001
1.11K
+1.11K
0.0%
jan 1, 2002
1.137K
+27.767
2.5%
jan 1, 2003
1.148K
+11.069
0.97%
jan 1, 2004
1.175K
+26.119
2.27%
jan 1, 2005
1.272K
+97.373
8.29%
jan 1, 2006
1.294K
+21.97
1.73%
jan 1, 2007
1.384K
+89.763
6.94%
jan 1, 2008
1.406K
+22.263
1.61%
jan 1, 2009
1.43K
+24.072
1.71%
jan 1, 2010
1.438K
+8.436
0.59%
jan 1, 2011
1.48K
+42.0
2.92%
jan 1, 2012
1.499K
+18.213
1.23%
jan 1, 2013
1.516K
+17.793
1.19%
jan 1, 2014
1.524K
+7.481
0.49%
jan 1, 2015
1.578K
+54.551
3.58%
jan 1, 2016
1.59K
+11.18
0.71%
Ranking of countries by current statistics by years