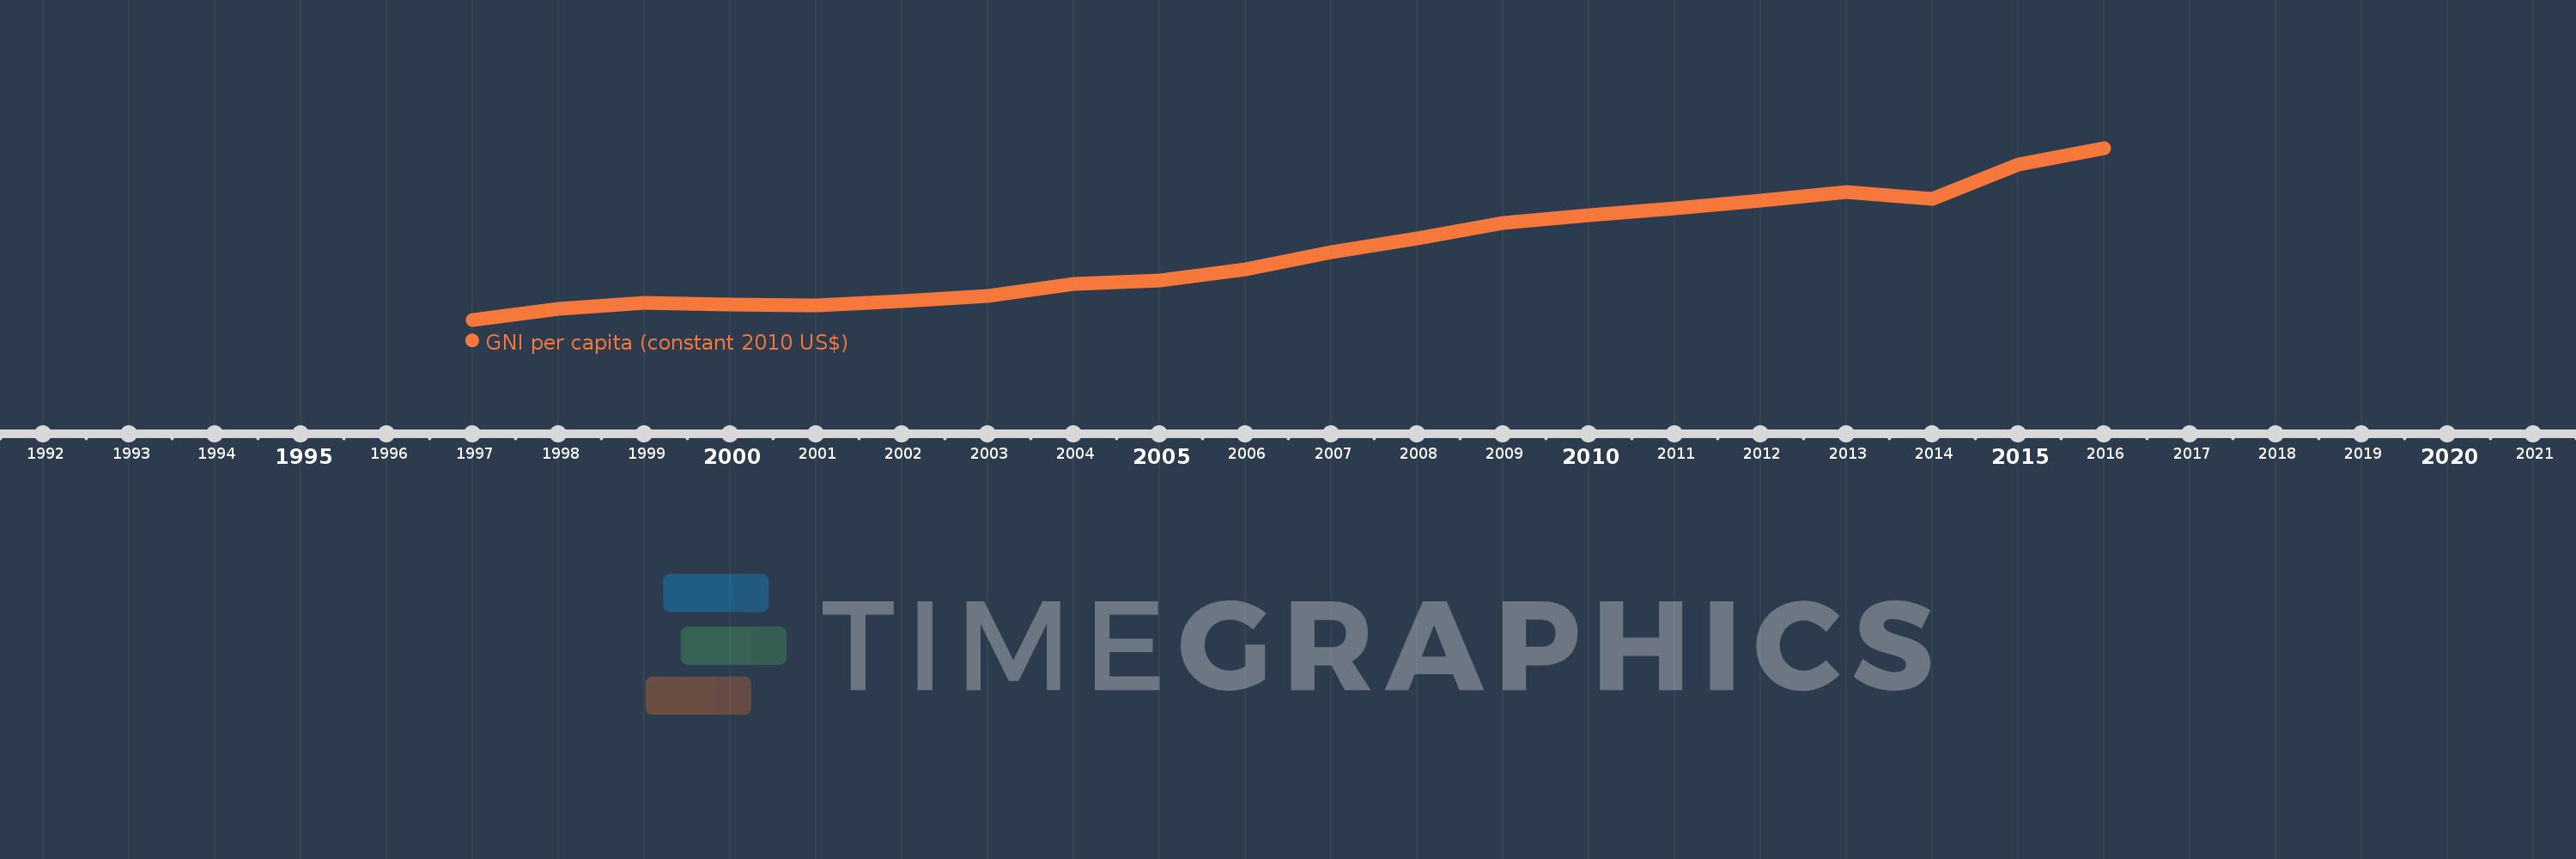
This timeline shows a graph from 1997 to 2016 of Heavily indebted poor countries (HIPC). No data until 1996. Number of actual observations by date: 20.
Source name:
World Development Indicators
Source organization:
World Bank national accounts data, and OECD National Accounts data files.
Categories, topics:
Economy & Growth
Last updated:
apr 23, 2017
Indicators value changes by year
Meaning:
647.117
Minimum:
544.891
jan 1, 1997
Maximum:
798.503
jan 1, 2016
At the date of observation
Value
Absolute change
Change from the previous value
jan 1, 1997
544.891
+544.891
0.0%
jan 1, 1998
560.43
+15.539
2.85%
jan 1, 1999
570.492
+10.062
1.8%
jan 1, 2000
567.904
-2.588
-0.45%
jan 1, 2001
566.158
-1.746
-0.31%
jan 1, 2002
572.085
+5.927
1.05%
jan 1, 2003
580.42
+8.334
1.46%
jan 1, 2004
598.245
+17.825
3.07%
jan 1, 2005
603.461
+5.217
0.87%
jan 1, 2006
619.876
+16.415
2.72%
jan 1, 2007
645.096
+25.22
4.07%
jan 1, 2008
665.282
+20.186
3.13%
jan 1, 2009
688.086
+22.804
3.43%
jan 1, 2010
699.638
+11.552
1.68%
jan 1, 2011
709.181
+9.543
1.36%
jan 1, 2012
721.097
+11.916
1.68%
jan 1, 2013
733.55
+12.453
1.73%
jan 1, 2014
723.532
-10.018
-1.37%
jan 1, 2015
774.417
+50.885
7.03%
jan 1, 2016
798.503
+24.087
3.11%
Ranking of countries by current statistics by years