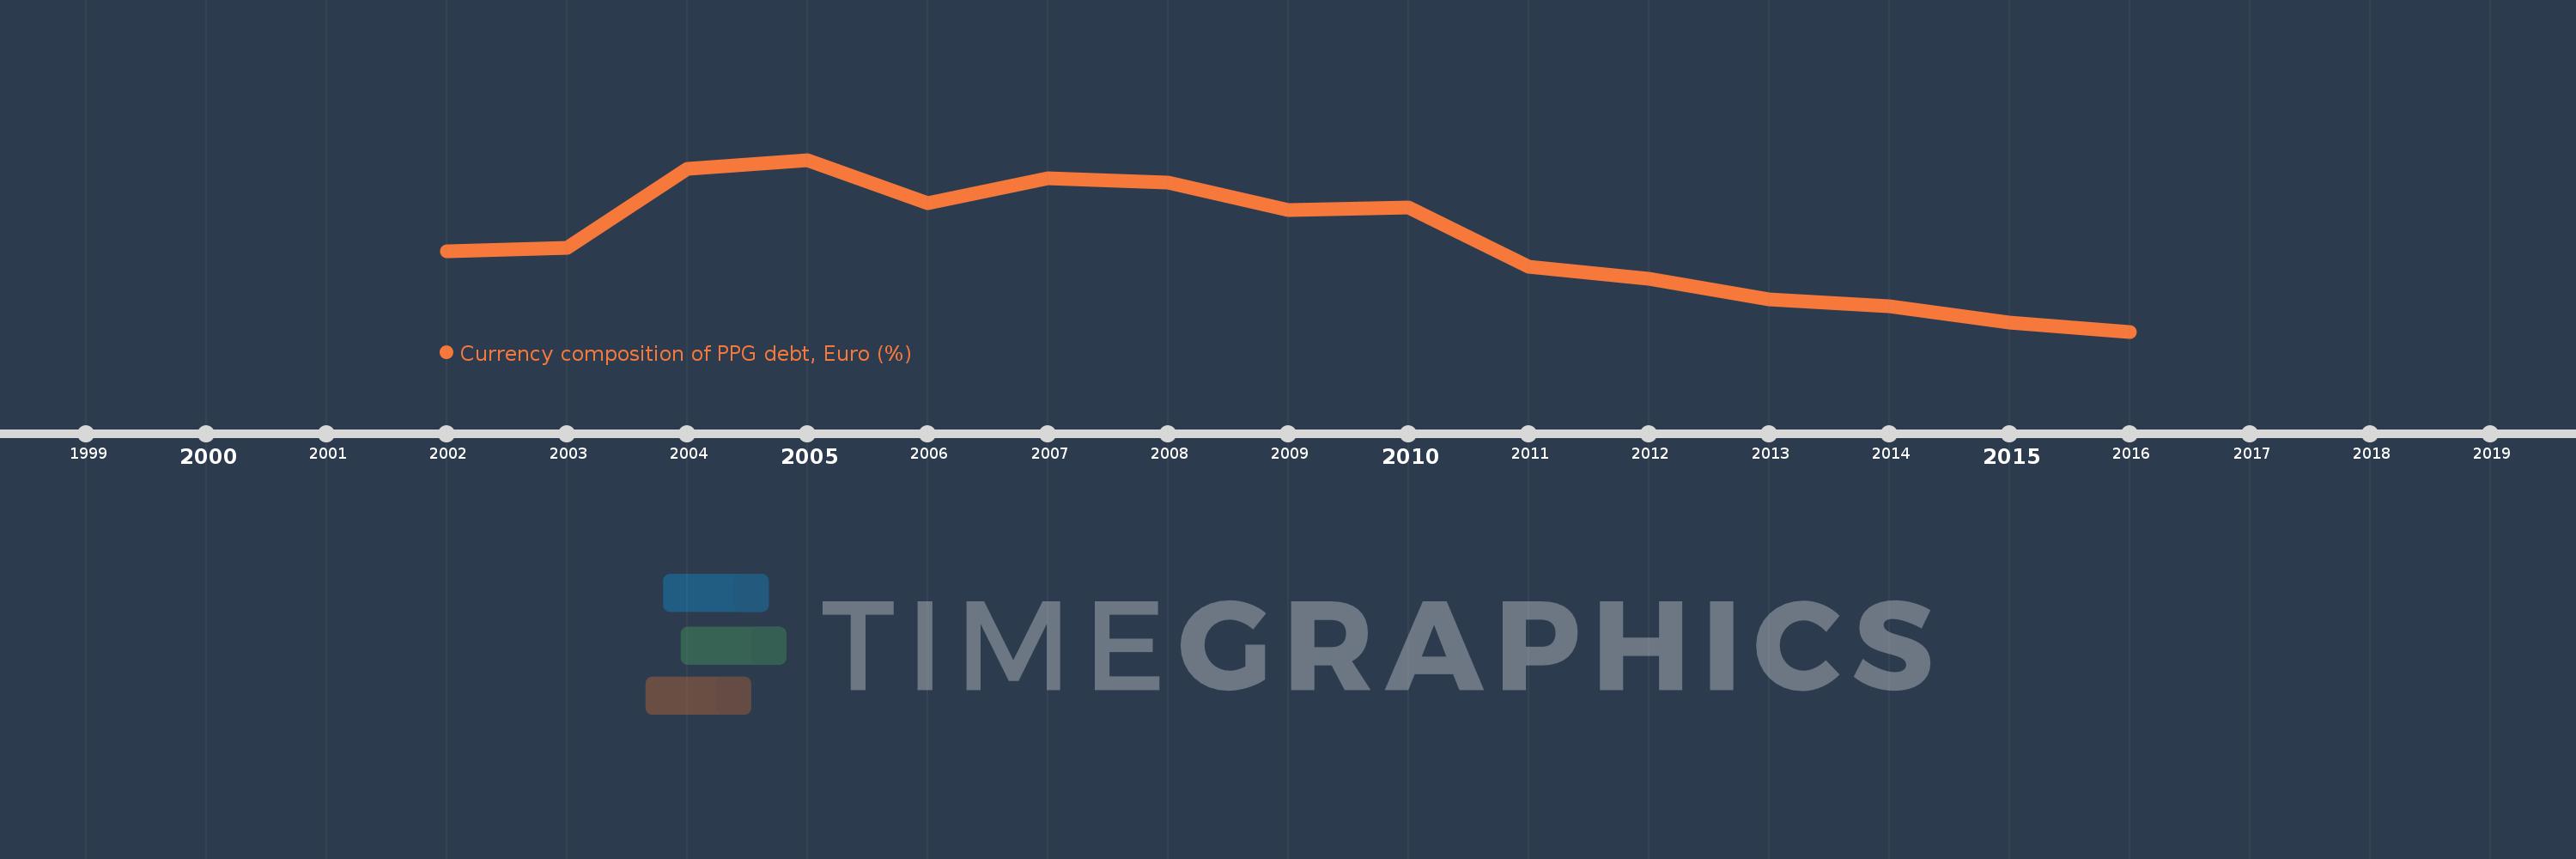
This timeline shows a graph from 2002 to 2016 of Sub-Saharan Africa (excluding high income). No data until 2001. Number of actual observations by date: 15.
Source name:
World Development Indicators
Source organization:
World Bank, International Debt Statistics.
Categories, topics:
External Debt
Last updated:
apr 23, 2017
Indicators value changes by year
Meaning:
15.912
Minimum:
7.067
jan 1, 2016
Maximum:
23.826
jan 1, 2005
At the date of observation
Value
Absolute change
Change from the previous value
jan 1, 2002
14.894
+14.894
0.0%
jan 1, 2003
15.232
+0.339
2.27%
jan 1, 2004
22.926
+7.694
50.51%
jan 1, 2005
23.826
+0.9
3.92%
jan 1, 2006
19.59
-4.235
-17.78%
jan 1, 2007
22.05
+2.459
12.55%
jan 1, 2008
21.63
-0.419
-1.9%
jan 1, 2009
18.919
-2.711
-12.53%
jan 1, 2010
19.166
+0.247
1.31%
jan 1, 2011
13.423
-5.744
-29.97%
jan 1, 2012
12.245
-1.178
-8.78%
jan 1, 2013
10.219
-2.026
-16.55%
jan 1, 2014
9.502
-0.717
-7.02%
jan 1, 2015
7.985
-1.517
-15.96%
jan 1, 2016
7.067
-0.918
-11.49%
Ranking of countries by current statistics by years