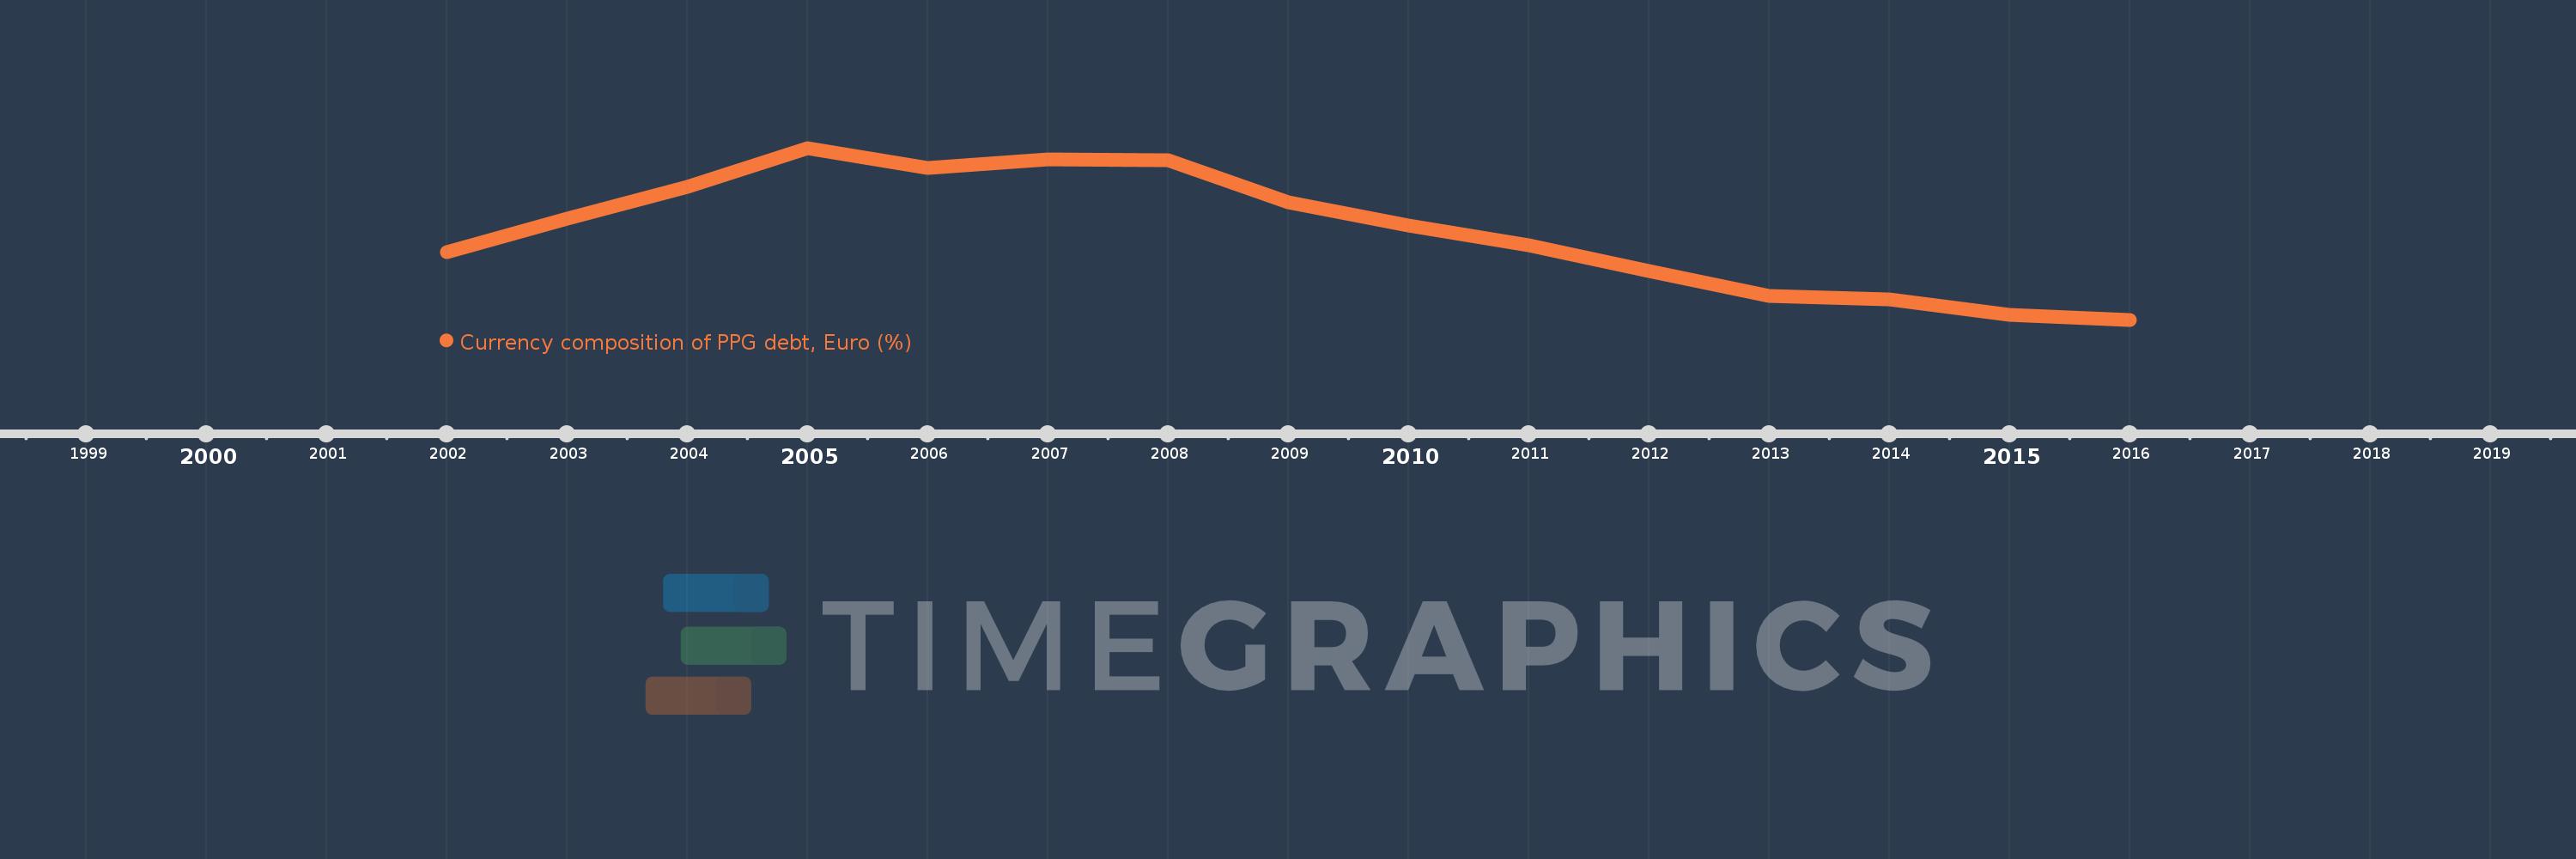
This timeline shows a graph from 2002 to 2016 of East Asia & Pacific (excluding high income). No data until 2001. Number of actual observations by date: 15.
Source name:
World Development Indicators
Source organization:
World Bank, International Debt Statistics.
Categories, topics:
External Debt
Last updated:
apr 23, 2017
Indicators value changes by year
Meaning:
5.665
Minimum:
2.561
jan 1, 2016
Maximum:
8.578
jan 1, 2005
At the date of observation
Value
Absolute change
Change from the previous value
jan 1, 2002
4.943
+4.943
0.0%
jan 1, 2003
6.107
+1.164
23.55%
jan 1, 2004
7.222
+1.115
18.26%
jan 1, 2005
8.578
+1.356
18.77%
jan 1, 2006
7.871
-0.707
-8.24%
jan 1, 2007
8.175
+0.304
3.86%
jan 1, 2008
8.157
-0.018
-0.22%
jan 1, 2009
6.675
-1.482
-18.17%
jan 1, 2010
5.865
-0.81
-12.14%
jan 1, 2011
5.157
-0.707
-12.06%
jan 1, 2012
4.252
-0.905
-17.56%
jan 1, 2013
3.405
-0.847
-19.92%
jan 1, 2014
3.27
-0.135
-3.96%
jan 1, 2015
2.742
-0.528
-16.14%
jan 1, 2016
2.561
-0.182
-6.62%
Ranking of countries by current statistics by years