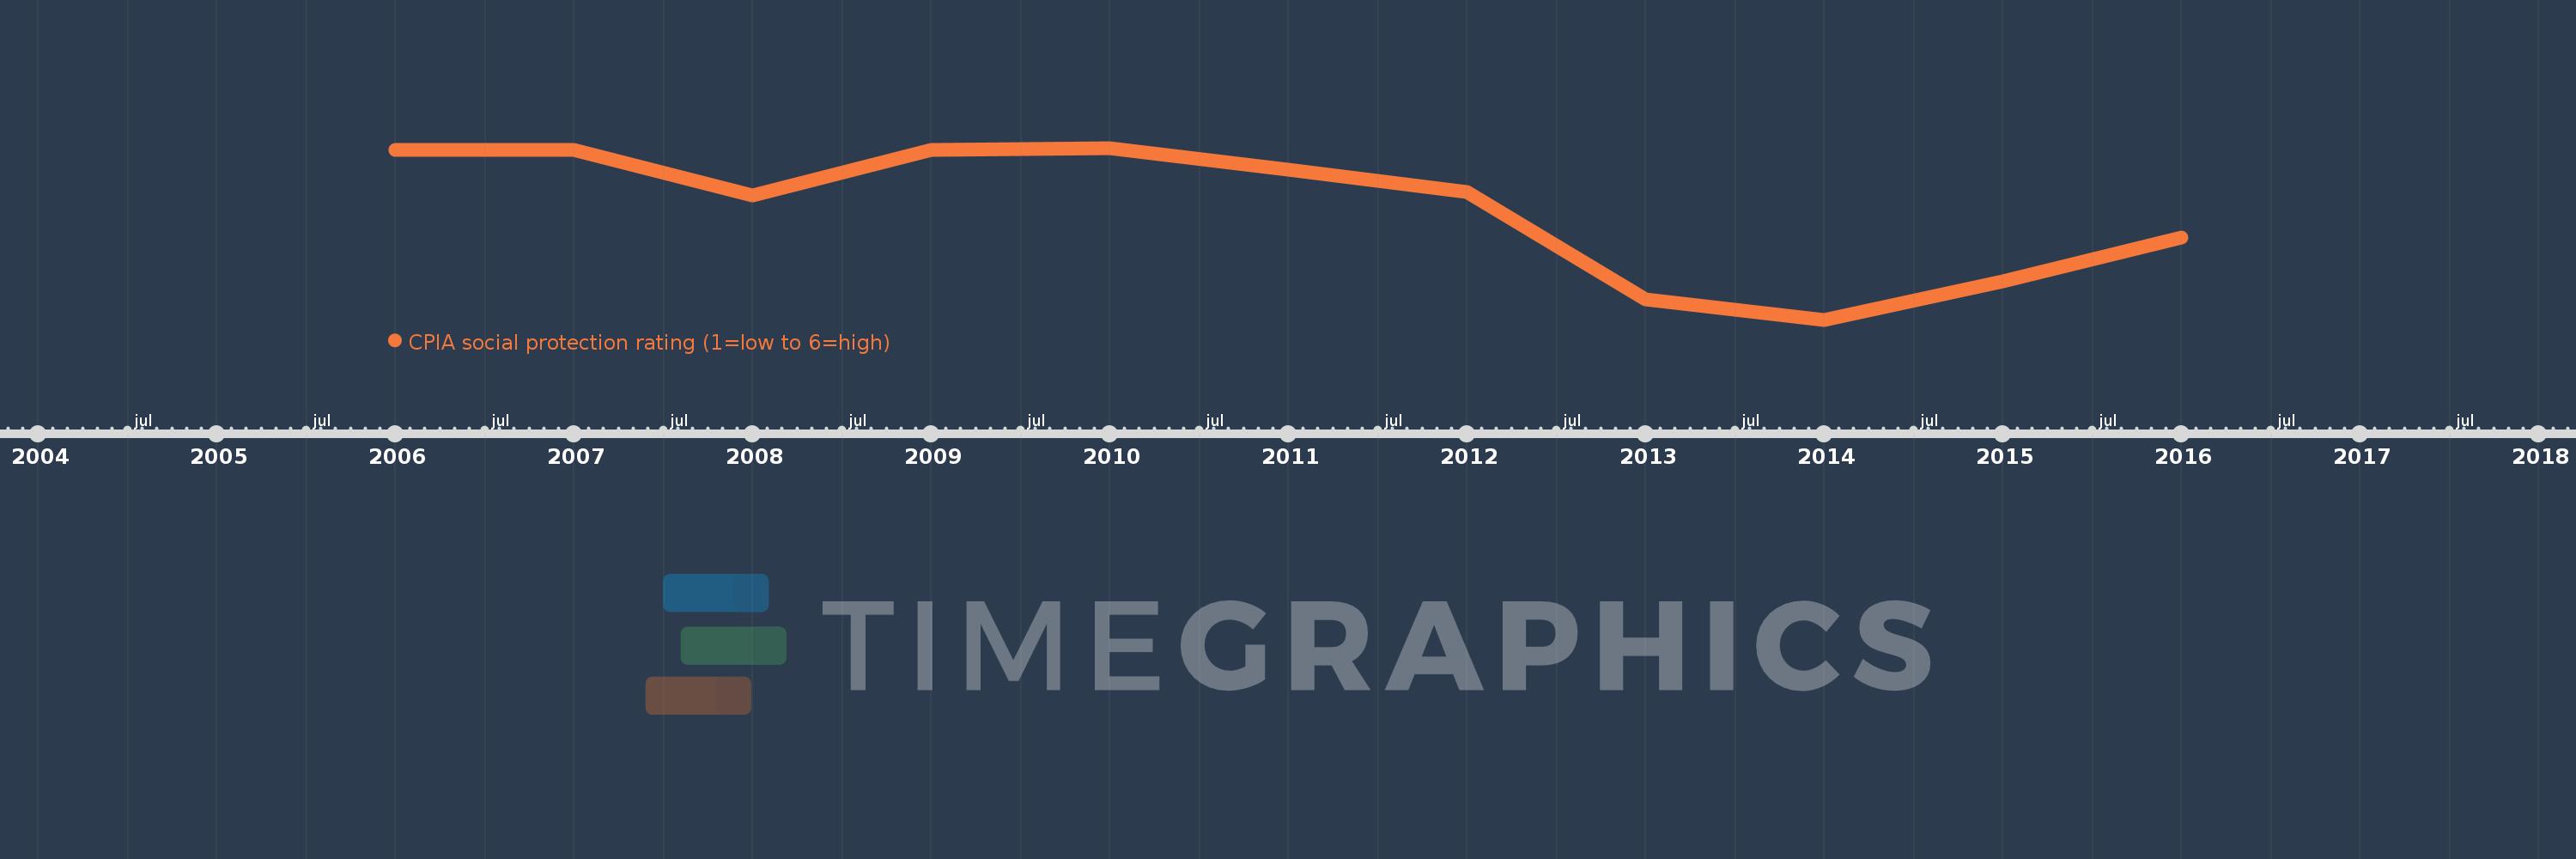
This timeline shows a graph from 2006 to 2016 of Sub-Saharan Africa (excluding high income). No data until 2005. Number of actual observations by date: 11.
Source name:
World Development Indicators
Source organization:
World Bank Group, CPIA database (http://www.worldbank.org/ida).
Categories, topics:
Public Sector
Last updated:
apr 23, 2017
Indicators value changes by year
Meaning:
2.951
Minimum:
2.885
jan 1, 2014
Maximum:
2.987
jan 1, 2010
At the date of observation
Value
Absolute change
Change from the previous value
jan 1, 2006
2.986
+2.986
0.0%
jan 1, 2007
2.986
0.0
-0.01%
jan 1, 2008
2.959
-0.027
-0.89%
jan 1, 2009
2.986
+0.027
0.91%
jan 1, 2010
2.987
+0.0
0.01%
jan 1, 2011
2.974
-0.013
-0.44%
jan 1, 2012
2.961
-0.013
-0.44%
jan 1, 2013
2.897
-0.063
-2.13%
jan 1, 2014
2.885
-0.013
-0.44%
jan 1, 2015
2.908
+0.023
0.81%
jan 1, 2016
2.934
+0.026
0.9%
Ranking of countries by current statistics by years