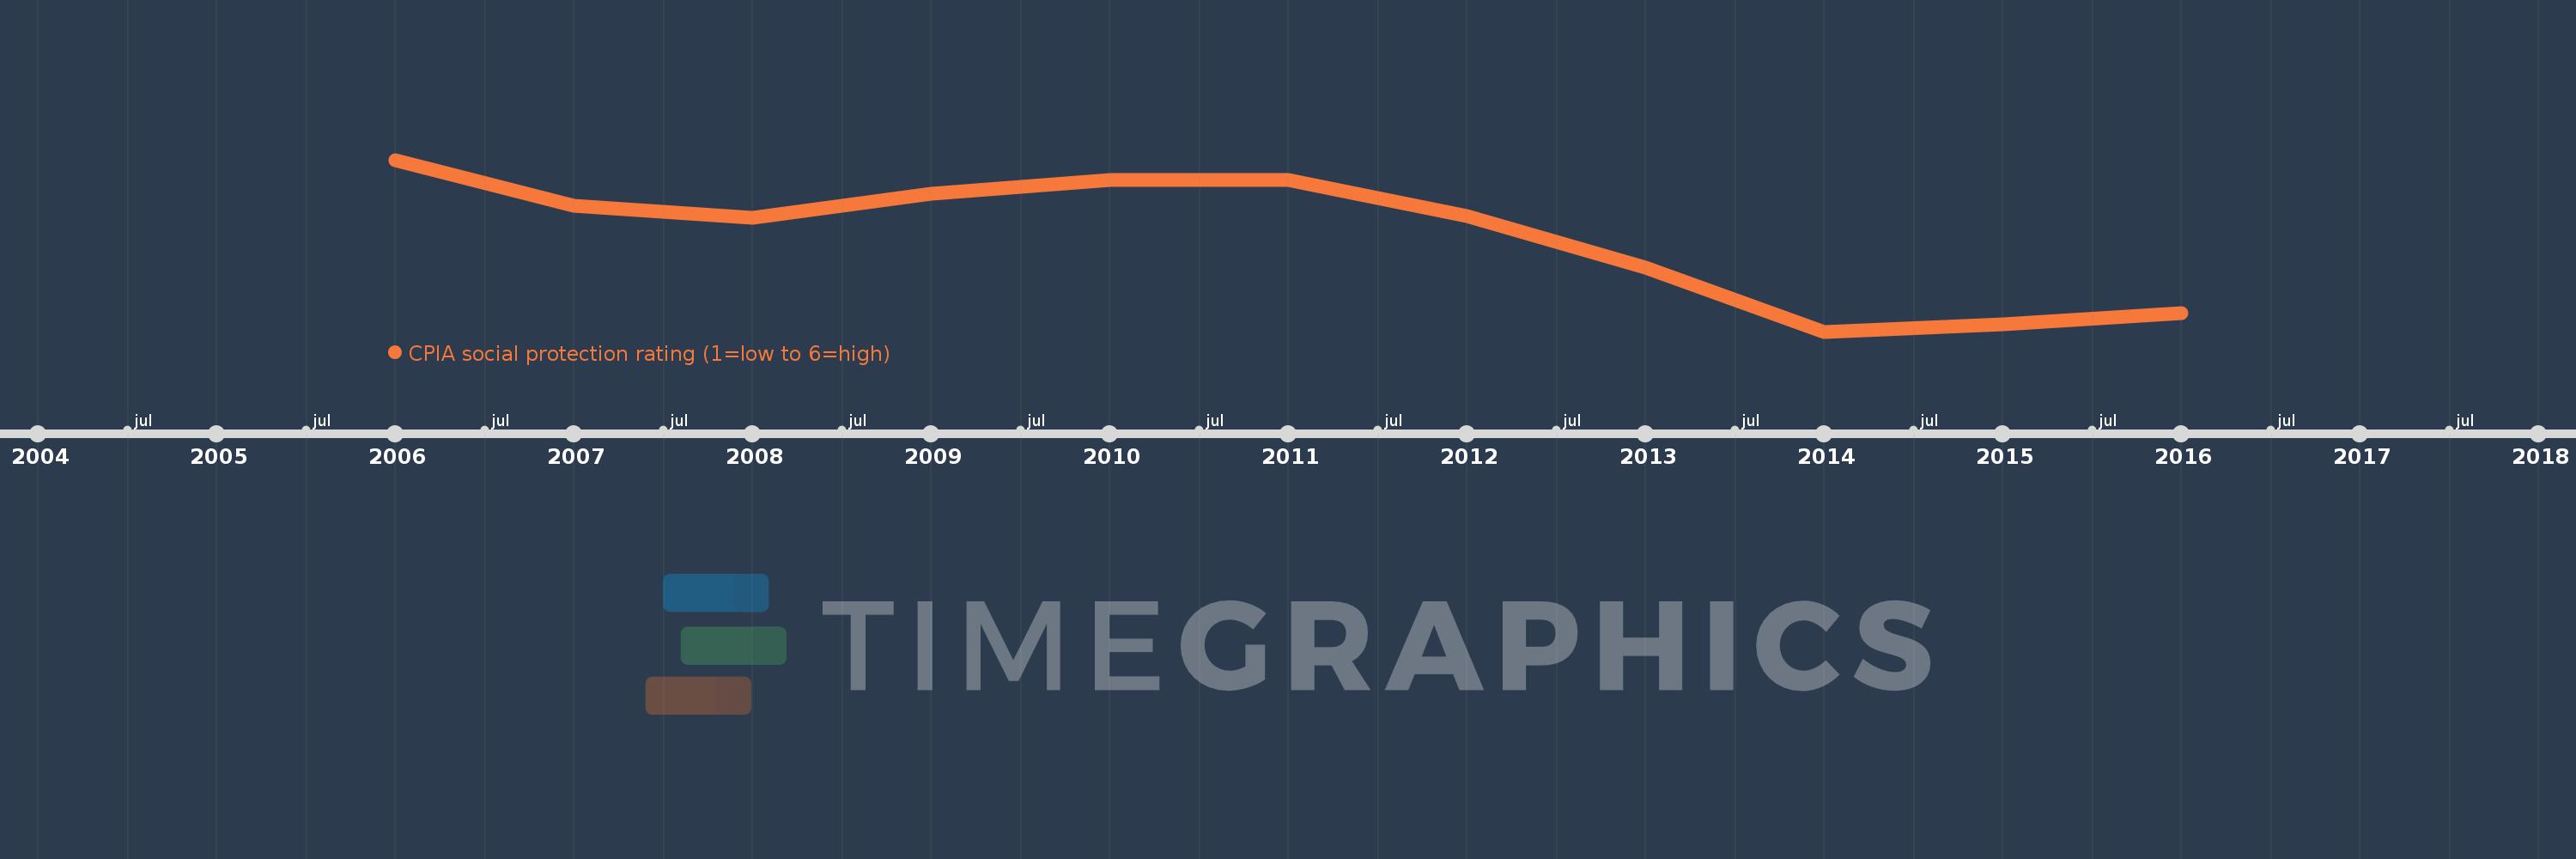
This timeline shows a graph from 2006 to 2016 of Least developed countries: UN classification. No data until 2005. Number of actual observations by date: 11.
Source name:
World Development Indicators
Source organization:
World Bank Group, CPIA database (http://www.worldbank.org/ida).
Categories, topics:
Public Sector
Last updated:
apr 23, 2017
Indicators value changes by year
Meaning:
2.888
Minimum:
2.793
jan 1, 2014
Maximum:
2.962
jan 1, 2006
At the date of observation
Value
Absolute change
Change from the previous value
jan 1, 2006
2.962
+2.962
0.0%
jan 1, 2007
2.917
-0.046
-1.55%
jan 1, 2008
2.905
-0.012
-0.41%
jan 1, 2009
2.929
+0.024
0.82%
jan 1, 2010
2.942
+0.013
0.45%
jan 1, 2011
2.942
0.0
0.0%
jan 1, 2012
2.907
-0.035
-1.19%
jan 1, 2013
2.856
-0.051
-1.77%
jan 1, 2014
2.793
-0.062
-2.17%
jan 1, 2015
2.8
+0.007
0.23%
jan 1, 2016
2.811
+0.011
0.4%
Ranking of countries by current statistics by years