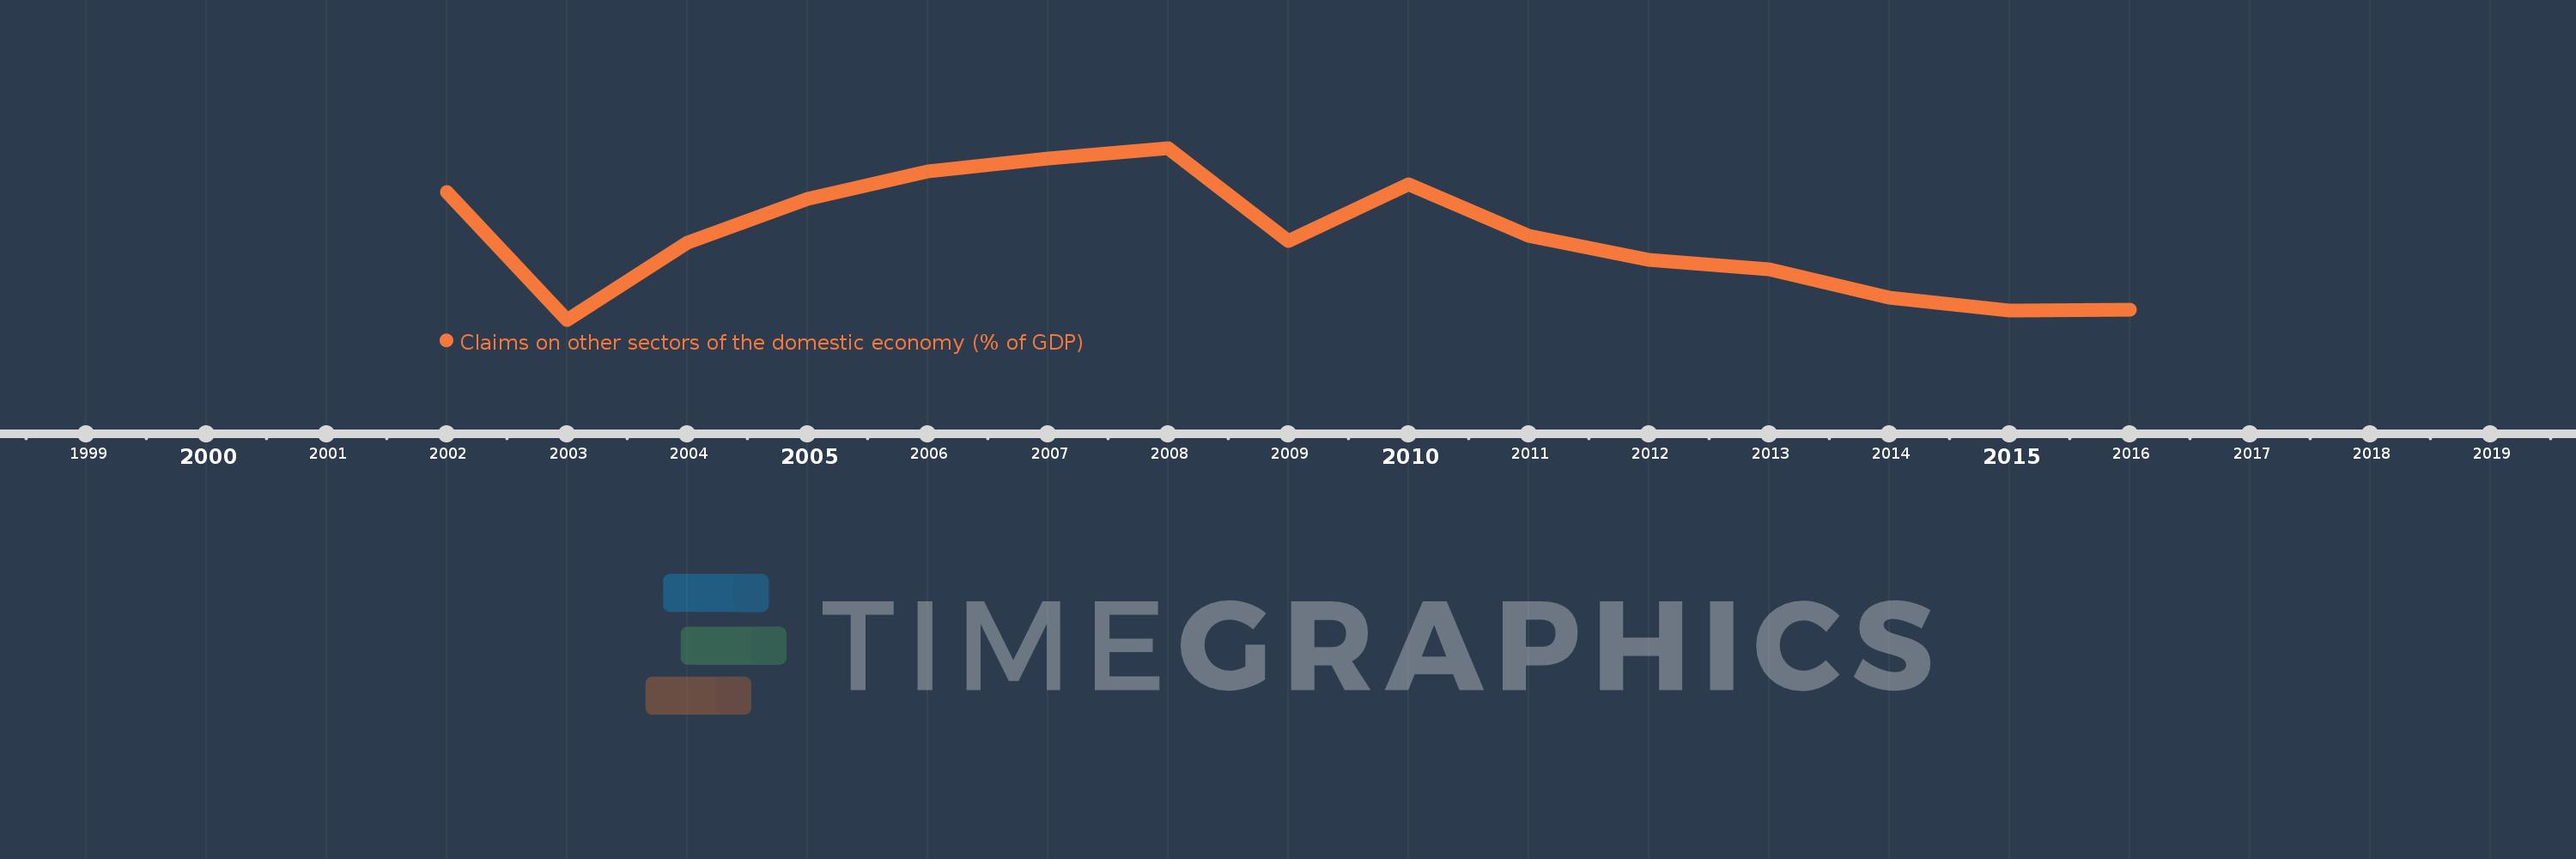
This timeline shows a graph from 2002 to 2016 of Sub-Saharan Africa (excluding high income). No data until 2001. Number of actual observations by date: 15.
Source name:
World Development Indicators
Source organization:
International Monetary Fund, International Financial Statistics and data files, and World Bank and OECD GDP estimates.
Categories, topics:
Financial Sector
Last updated:
apr 23, 2017
Indicators value changes by year
Meaning:
61.603
Minimum:
50.599
jan 1, 2003
Maximum:
73.175
jan 1, 2008
At the date of observation
Value
Absolute change
Change from the previous value
jan 1, 2002
67.345
+67.345
0.0%
jan 1, 2003
50.599
-16.745
-24.87%
jan 1, 2004
60.748
+10.149
20.06%
jan 1, 2005
66.435
+5.688
9.36%
jan 1, 2006
70.109
+3.673
5.53%
jan 1, 2007
71.791
+1.682
2.4%
jan 1, 2008
73.175
+1.385
1.93%
jan 1, 2009
60.905
-12.27
-16.77%
jan 1, 2010
68.394
+7.489
12.3%
jan 1, 2011
61.628
-6.766
-9.89%
jan 1, 2012
58.442
-3.186
-5.17%
jan 1, 2013
57.247
-1.195
-2.05%
jan 1, 2014
53.526
-3.721
-6.5%
jan 1, 2015
51.763
-1.762
-3.29%
jan 1, 2016
51.937
+0.174
0.34%
Ranking of countries by current statistics by years