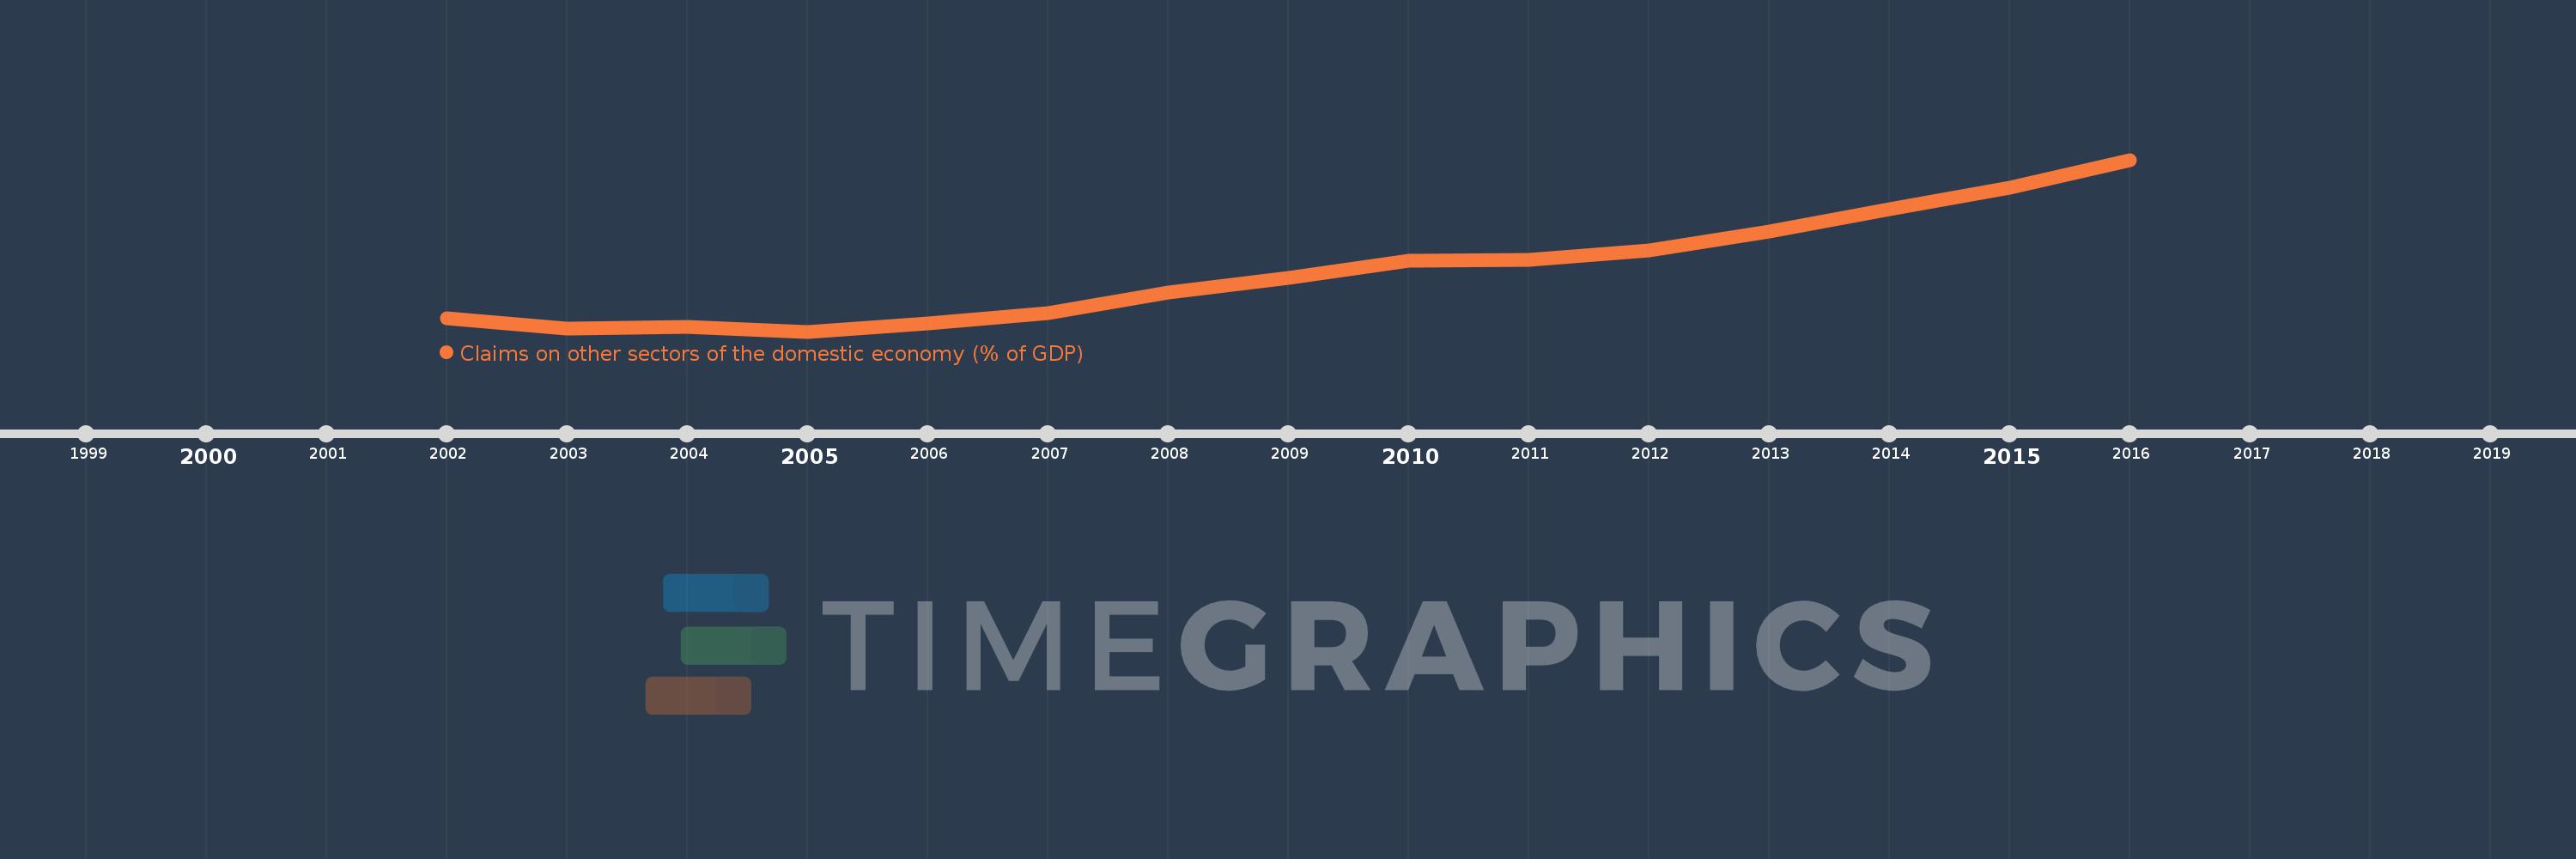
This timeline shows a graph from 2002 to 2016 of Heavily indebted poor countries (HIPC). No data until 2001. Number of actual observations by date: 15.
Source name:
World Development Indicators
Source organization:
International Monetary Fund, International Financial Statistics and data files, and World Bank and OECD GDP estimates.
Categories, topics:
Financial Sector
Last updated:
apr 23, 2017
Indicators value changes by year
Meaning:
17.078
Minimum:
13.932
jan 1, 2005
Maximum:
22.914
jan 1, 2016
At the date of observation
Value
Absolute change
Change from the previous value
jan 1, 2002
14.615
+14.615
0.0%
jan 1, 2003
14.1
-0.515
-3.52%
jan 1, 2004
14.197
+0.097
0.69%
jan 1, 2005
13.932
-0.265
-1.87%
jan 1, 2006
14.376
+0.444
3.19%
jan 1, 2007
14.878
+0.502
3.49%
jan 1, 2008
15.978
+1.1
7.39%
jan 1, 2009
16.758
+0.78
4.88%
jan 1, 2010
17.635
+0.877
5.23%
jan 1, 2011
17.665
+0.031
0.17%
jan 1, 2012
18.186
+0.52
2.94%
jan 1, 2013
19.18
+0.994
5.47%
jan 1, 2014
20.317
+1.137
5.93%
jan 1, 2015
21.444
+1.126
5.54%
jan 1, 2016
22.914
+1.47
6.86%
Ranking of countries by current statistics by years