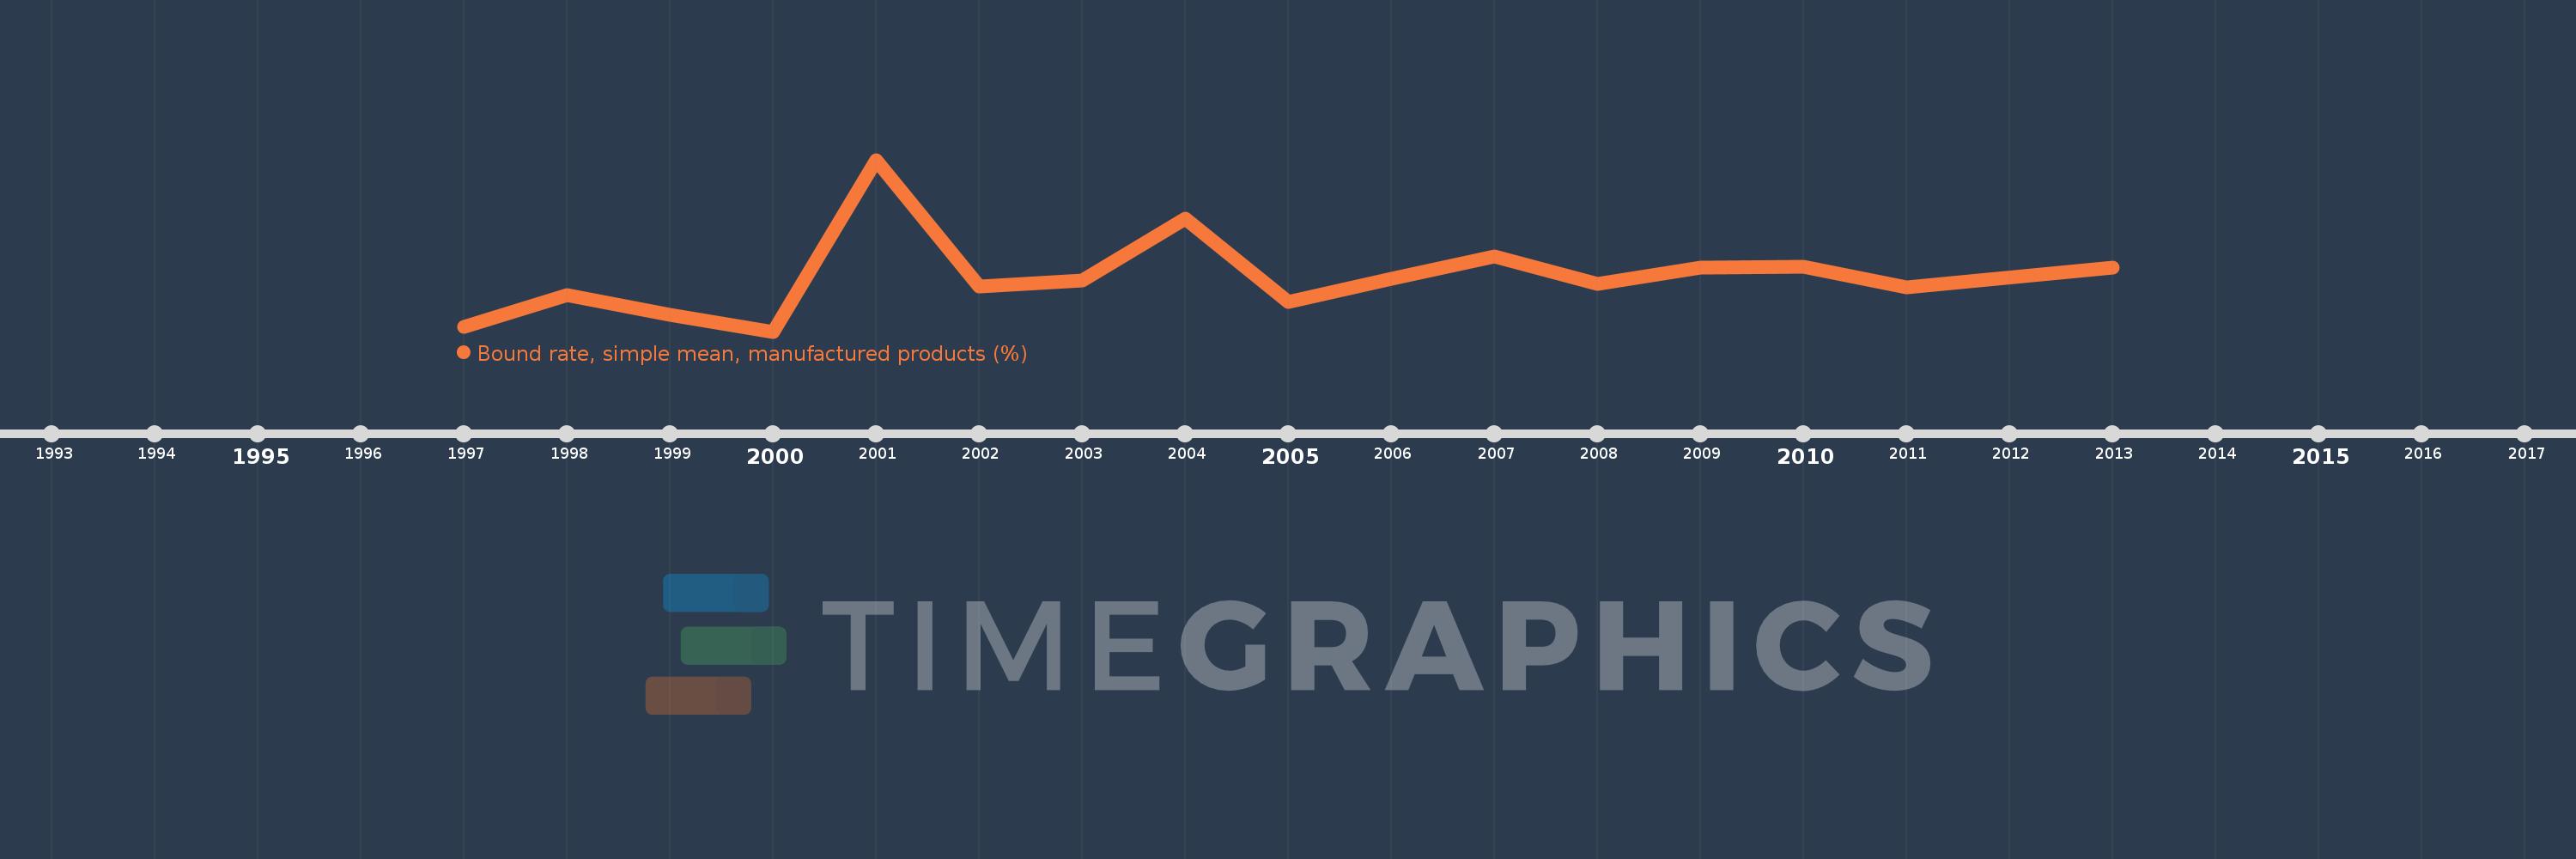
This timeline shows a graph from 1997 to 2013 of Sub-Saharan Africa (excluding high income). No data until 1996. Number of actual observations by date: 16.
Source name:
World Development Indicators
Source organization:
World Bank staff estimates using the World Integrated Trade Solution system, based on data from World Trade Organization.
Categories, topics:
Private Sector, Trade
Last updated:
apr 23, 2017
Indicators value changes by year
Meaning:
35.557
Minimum:
20.85
jan 1, 2000
Maximum:
66.64
jan 1, 2001
At the date of observation
Value
Absolute change
Change from the previous value
jan 1, 1997
22.21
+22.21
0.0%
jan 1, 1998
30.52
+8.31
37.42%
jan 1, 1999
25.4
-5.12
-16.78%
jan 1, 2000
20.85
-4.55
-17.91%
jan 1, 2001
66.64
+45.79
219.62%
jan 1, 2002
32.95
-33.69
-50.56%
jan 1, 2003
34.37
+1.42
4.31%
jan 1, 2004
50.95
+16.58
48.24%
jan 1, 2005
28.73
-22.22
-43.61%
jan 1, 2006
35.01
+6.28
21.86%
jan 1, 2007
40.89
+5.88
16.8%
jan 1, 2008
33.52
-7.37
-18.02%
jan 1, 2009
37.98
+4.46
13.31%
jan 1, 2010
38.24
+0.26
0.68%
jan 1, 2011
32.7
-5.54
-14.49%
jan 1, 2013
37.95
+5.25
16.06%
Ranking of countries by current statistics by years