33
/
AIzaSyAYiBZKx7MnpbEhh9jyipgxe19OcubqV5w
August 1, 2025
27903
East Asia & Pacific (excluding high income)
EAP
false
2
1
Bound rate, simple mean, manufactured products (%)
2013,2011,2010,2009,2008,2007,2006,2005,2004,2003,2002,2001,2000,1999,1998,1997
Download
Global statistics library →East Asia & Pacific (excluding high income) →

Bound rate, simple mean, manufactured products (%)

This statistics in other country:

AlbaniaAngolaAntigua and BarbudaArgentinaArmeniaAustraliaAustriaBahrainBangladeshBarbadosBelgiumBelizeBeninBoliviaBotswanaBrazilBrunei DarussalamBulgariaBurkina FasoBurundiCabo VerdeCambodiaCameroonCanadaCentral African RepublicChadChileChinaColombiaCongo, Dem. Rep.Congo, Rep.Costa RicaCote d'IvoireCubaCyprusCzech RepublicDenmarkDjiboutiDominicaDominican RepublicEast Asia & Pacific (excluding high income)EcuadorEgypt, Arab Rep.El SalvadorEstoniaEurope & Central Asia (excluding high income)European UnionFijiFinlandFranceGabonGambia, TheGeorgiaGermanyGhanaGreeceGrenadaGuatemalaGuineaGuinea-BissauGuyanaHaitiHigh incomeHondurasHong Kong SAR, ChinaHungaryIcelandIndiaIndonesiaIrelandIsraelItalyJamaicaJapanJordanKenyaKorea, Rep.KuwaitKyrgyz RepublicLatin America & Caribbean (excluding high income)LatviaLesothoLithuaniaLow & middle incomeLow incomeLower middle incomeLuxembourgMacao SAR, ChinaMacedonia, FYRMadagascarMalawiMalaysiaMaldivesMaliMaltaMauritaniaMauritiusMexicoMiddle East & North Africa (excluding high income)Middle incomeMoldovaMongoliaMoroccoMozambiqueMyanmarNamibiaNepalNetherlandsNew ZealandNicaraguaNigerNigeriaNorwayOECD membersOmanPakistanPanamaPapua New GuineaParaguayPeruPhilippinesPolandPortugalQatarRomaniaRwandaSaudi ArabiaSenegalSierra LeoneSingaporeSlovak RepublicSloveniaSolomon IslandsSouth AfricaSouth AsiaSpainSri LankaSt. Kitts and NevisSt. LuciaSt. Vincent and the GrenadinesSub-Saharan Africa (excluding high income)SurinameSwazilandSwedenSwitzerlandTanzaniaThailandTogoTongaTrinidad and TobagoTunisiaTurkeyUgandaUkraineUnited Arab EmiratesUnited KingdomUnited StatesUpper middle incomeUruguayVenezuela, RBVietnamWorldZambiaZimbabwe

Timeline:

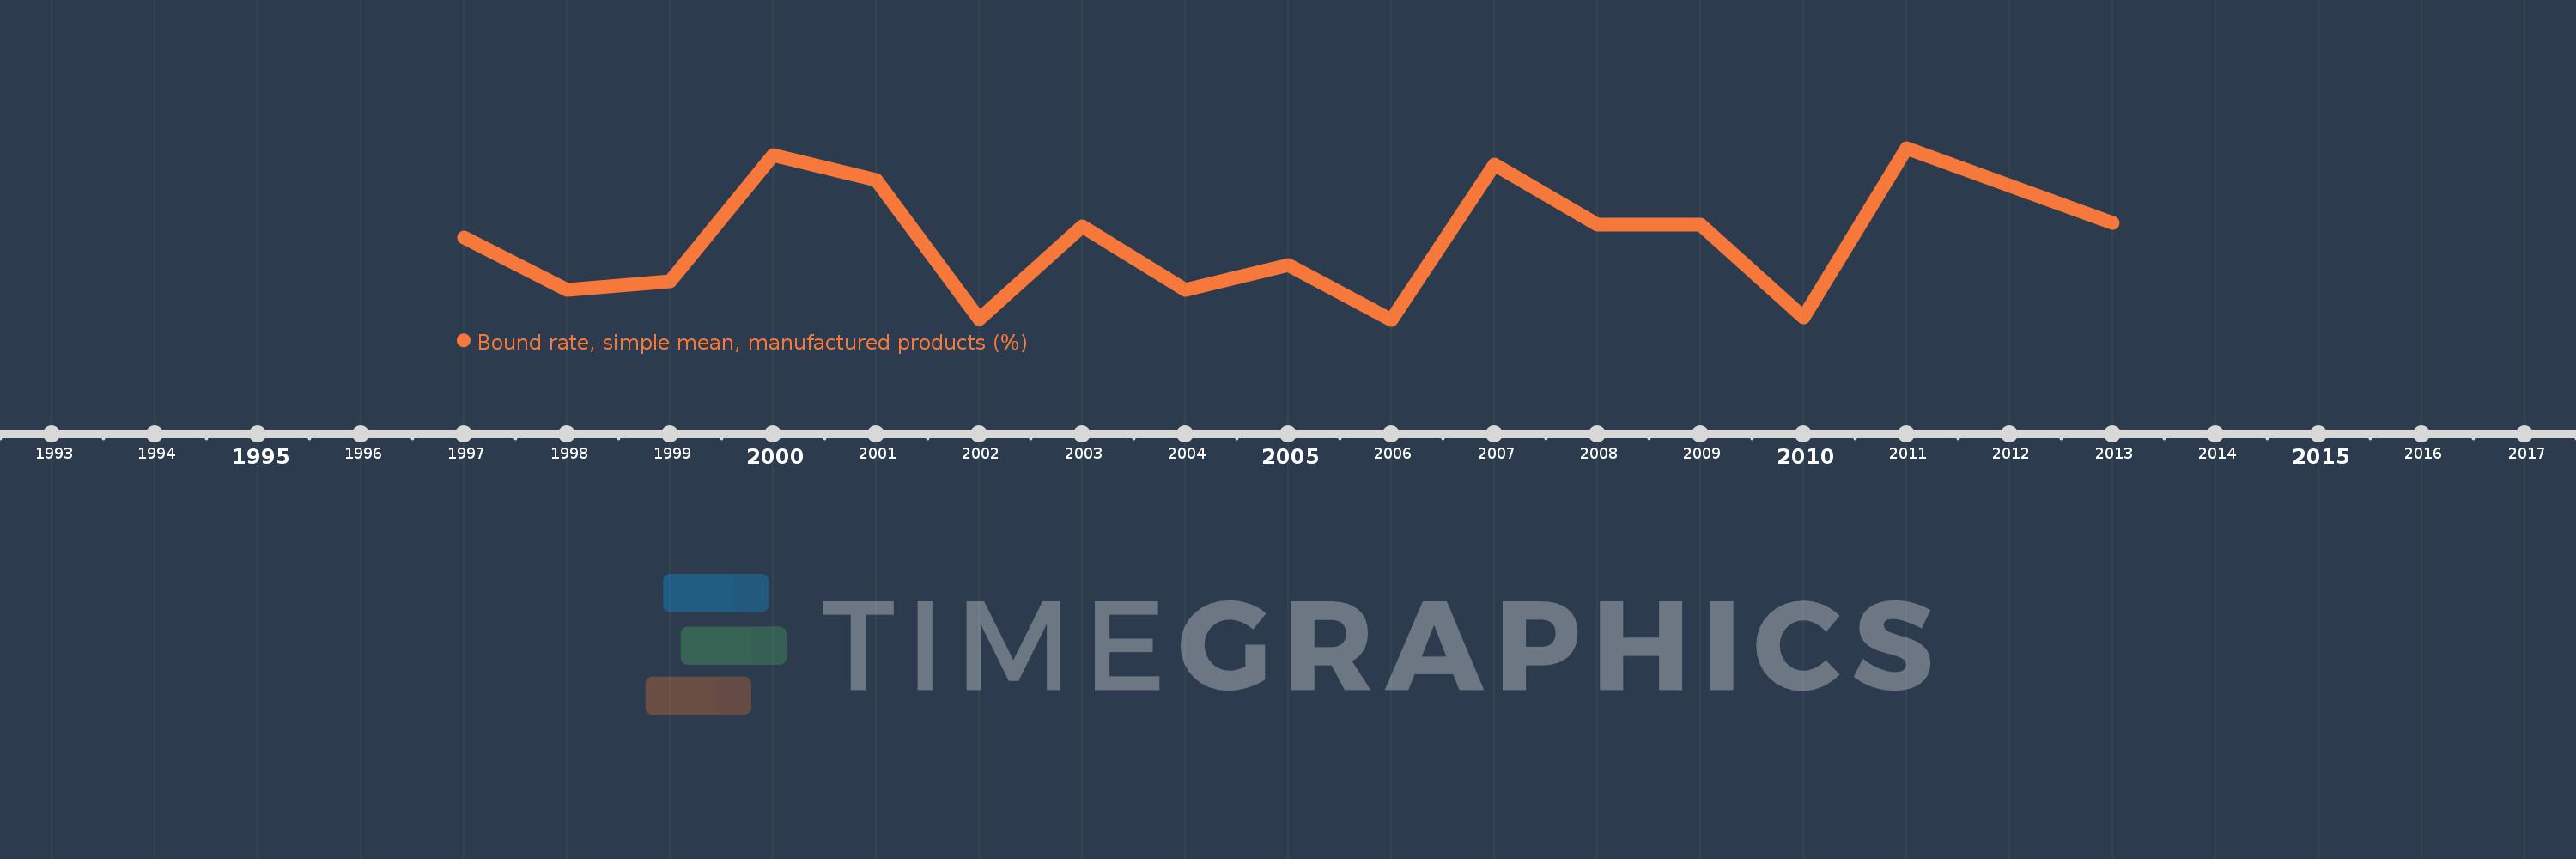
This timeline shows a graph from 1997 to 2013 of East Asia & Pacific (excluding high income). No data until 1996. Number of actual observations by date: 16.

Source name:

World Development Indicators

Source organization:

World Bank staff estimates using the World Integrated Trade Solution system, based on data from World Trade Organization.

Categories, topics:

Private Sector, Trade

Last updated:

apr 23, 2017

Indicators value changes by year

Meaning:
25.814
Minimum:
21.5
jan 1, 2006
Maximum:
30.99
jan 1, 2011
At the date of observation
Value
Absolute change
Change from the previous value
jan 1, 1997
26.02
+26.02
0.0%
jan 1, 1998
23.14
-2.88
-11.07%
jan 1, 1999
23.64
+0.5
2.16%
jan 1, 2000
30.59
+6.95
29.4%
jan 1, 2001
29.24
-1.35
-4.41%
jan 1, 2002
21.53
-7.71
-26.37%
jan 1, 2003
26.66
+5.13
23.83%
jan 1, 2004
23.14
-3.52
-13.2%
jan 1, 2005
24.53
+1.39
6.01%
jan 1, 2006
21.5
-3.03
-12.35%
jan 1, 2007
30.06
+8.56
39.81%
jan 1, 2008
26.77
-3.29
-10.94%
jan 1, 2009
26.75
-0.02
-0.07%
jan 1, 2010
21.62
-5.13
-19.18%
jan 1, 2011
30.99
+9.37
43.34%
jan 1, 2013
26.84
-4.15
-13.39%

Ranking of countries by current statistics by years