33
/
AIzaSyB4mHJ5NPEv-XzF7P6NDYXjlkCWaeKw5bc
November 30, 2025
56497
Small states
SST
false
2
1
Newborns protected against tetanus (%)
2016,2015,2014,2013,2012,2011,2010,2009,2008,2007,2006,2005,2004,2003,2002,2001
Create a timeline
Public Timelines
For education
For educational institutions
For teachers
For students
Cabinet
For educational institutions
For teachers
For students
Open cabinet
FAQ
Close
Create a timeline
Public timelines
FAQ
About & Feedback
Terms
Privacy
FAQ
Support 24/7
Cabinet
Get premium
Donate
Download
Global statistics library
→
Small states
→
Newborns protected against tetanus (%)
This statistics in other country:
Afghanistan
Albania
Algeria
Angola
Arab World
Bahamas, The
Bahrain
Bangladesh
Belize
Benin
Bhutan
Bolivia
Botswana
Brazil
Brunei Darussalam
Burkina Faso
Burundi
Cabo Verde
Cambodia
Cameroon
Caribbean small states
Central African Republic
Chad
Colombia
Comoros
Congo, Dem. Rep.
Congo, Rep.
Cote d'Ivoire
Djibouti
Dominican Republic
Early-demographic dividend
Ecuador
Egypt, Arab Rep.
El Salvador
Equatorial Guinea
Eritrea
Ethiopia
Fiji
Fragile and conflict affected situations
Gabon
Gambia, The
Ghana
Guatemala
Guinea
Guinea-Bissau
Guyana
Haiti
Heavily indebted poor countries (HIPC)
Honduras
IDA & IBRD total
IDA blend
IDA only
IDA total
India
Indonesia
Iran, Islamic Rep.
Iraq
Jamaica
Jordan
Kenya
Kiribati
Korea, Dem. People’s Rep.
Kuwait
Lao PDR
Latin America & Caribbean
Latin America & Caribbean (excluding high income)
Latin America & the Caribbean (IDA & IBRD countries)
Least developed countries: UN classification
Lesotho
Liberia
Low & middle income
Low income
Lower middle income
Madagascar
Malawi
Malaysia
Maldives
Mali
Mauritania
Mauritius
Mexico
Middle East & North Africa
Middle East & North Africa (excluding high income)
Middle East & North Africa (IDA & IBRD countries)
Middle income
Morocco
Mozambique
Myanmar
Namibia
Nepal
Nicaragua
Niger
Nigeria
Oman
Other small states
Pacific island small states
Pakistan
Papua New Guinea
Paraguay
Peru
Philippines
Pre-demographic dividend
Rwanda
Sao Tome and Principe
Senegal
Seychelles
Sierra Leone
Small states
Solomon Islands
Somalia
South Africa
South Asia
South Asia (IDA & IBRD)
South Sudan
Sri Lanka
Sub-Saharan Africa
Sub-Saharan Africa (excluding high income)
Sub-Saharan Africa (IDA & IBRD countries)
Sudan
Suriname
Swaziland
Syrian Arab Republic
Tanzania
Thailand
Timor-Leste
Togo
Tunisia
Turkey
Uganda
Vanuatu
Venezuela, RB
Vietnam
Yemen, Rep.
Zambia
Zimbabwe
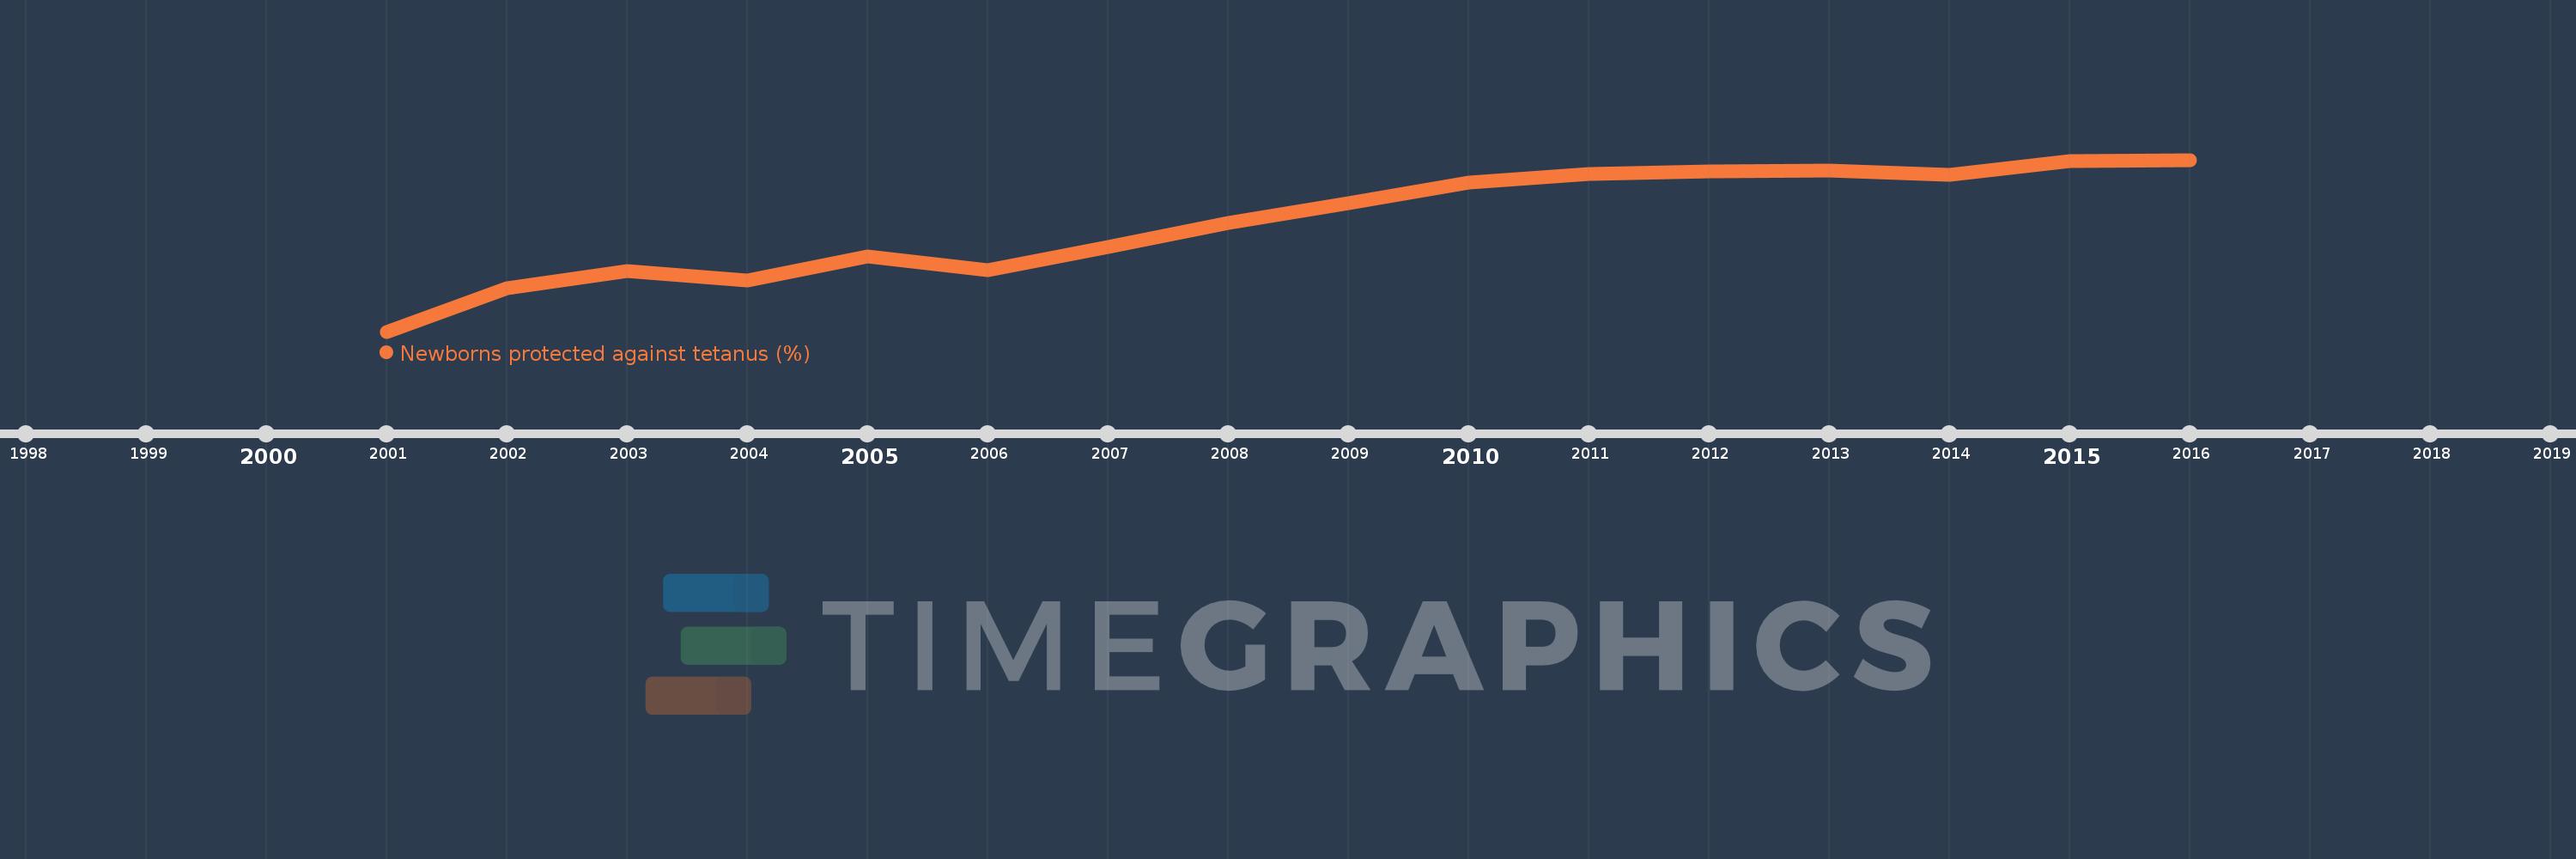
Timeline:
This timeline shows a graph from
2001
to
2016
of Small states. No data until
2000
. Number of actual observations by date:
16
.
Source name:
World Development Indicators
Source organization:
WHO and UNICEF (http://www.who.int/immunization/monitoring_surveillance/en/).
Categories, topics:
Health
Last updated:
apr 23, 2017
Indicators value changes by year
Meaning:
80.223
Minimum:
69.696
jan 1, 2001
Maximum:
86.328
jan 1, 2016
At the date of observation
Value
Absolute change
Change from the previous value
jan 1, 2001
69.696
+69.696
0.0%
jan 1, 2002
73.921
+4.225
6.06%
jan 1, 2003
75.581
+1.66
2.25%
jan 1, 2004
74.644
-0.937
-1.24%
jan 1, 2005
76.999
+2.355
3.16%
jan 1, 2006
75.612
-1.387
-1.8%
jan 1, 2007
77.886
+2.274
3.01%
jan 1, 2008
80.234
+2.347
3.01%
jan 1, 2009
82.1
+1.867
2.33%
jan 1, 2010
84.088
+1.987
2.42%
jan 1, 2011
84.992
+0.904
1.07%
jan 1, 2012
85.185
+0.193
0.23%
jan 1, 2013
85.288
+0.103
0.12%
jan 1, 2014
84.844
-0.444
-0.52%
jan 1, 2015
86.163
+1.319
1.55%
jan 1, 2016
86.328
+0.165
0.19%
Ranking of countries by current statistics by years
About & Feedback
Terms
Privacy
FAQ
Support 24/7
Cabinet
Get premium
Donate
The service accepts bank transfer (ACH, Wire) or cards (Visa, MasterCard, etc). Processed by Stripe.
Secured with SSL