Download This statistics in other country:
Timeline:
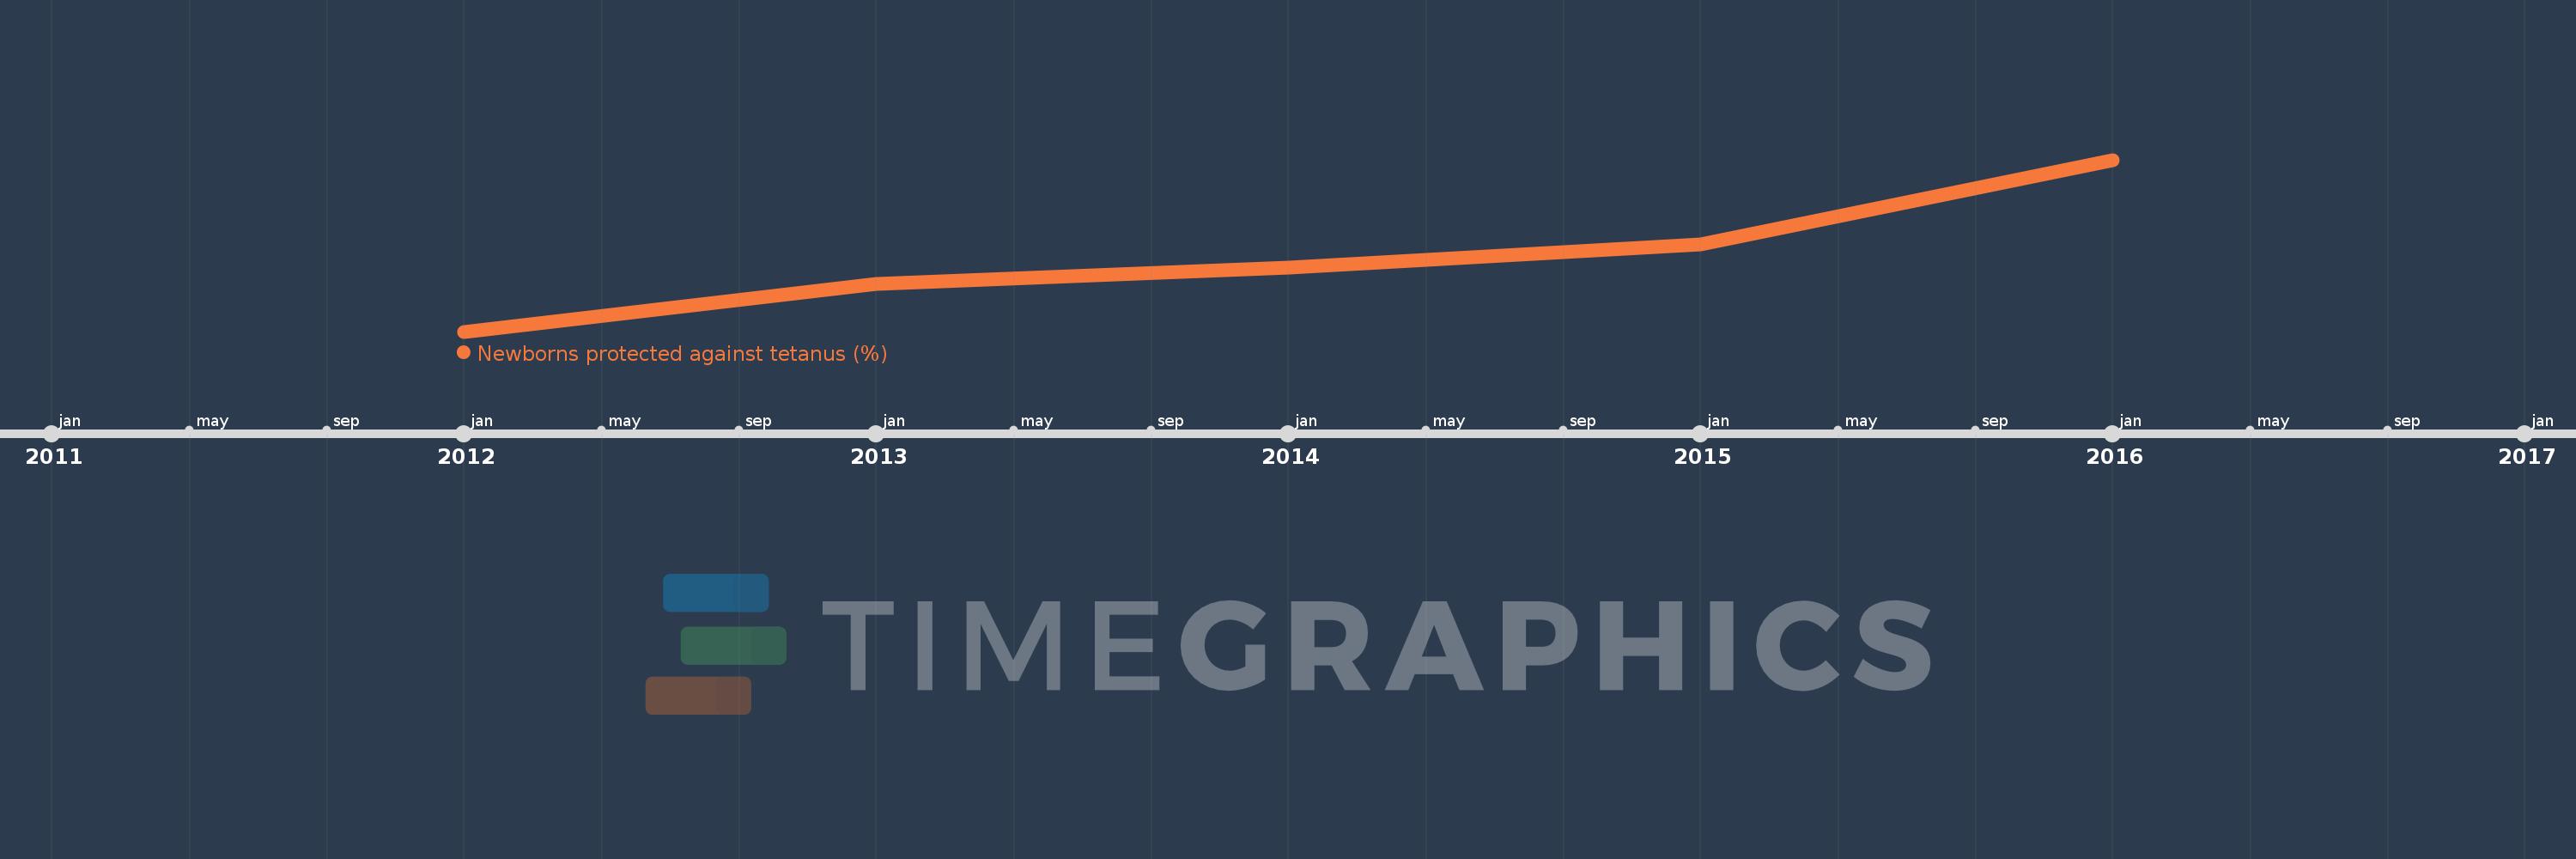
This timeline shows a graph from 2012 to 2016 of Middle income. No data until 2011. Number of actual observations by date: 5.
Source name:
World Development Indicators
Source organization:
WHO and UNICEF (http://www.who.int/immunization/monitoring_surveillance/en/).
Categories, topics:
Health
Last updated:
apr 23, 2017
Indicators value changes by year
Maximum:
83.495
jan 1, 2016
At the date of observation
Value
Absolute change
Change from the previous value
jan 1, 2012
82.73
+82.73
0.0%
jan 1, 2013
82.941
+0.21
0.25%
jan 1, 2014
83.014
+0.073
0.09%
jan 1, 2015
83.119
+0.106
0.13%
jan 1, 2016
83.495
+0.376
0.45%
Ranking of countries by current statistics by years