33
/
AIzaSyB4mHJ5NPEv-XzF7P6NDYXjlkCWaeKw5bc
November 30, 2025
55983
Pre-demographic dividend
PRE
false
2
1
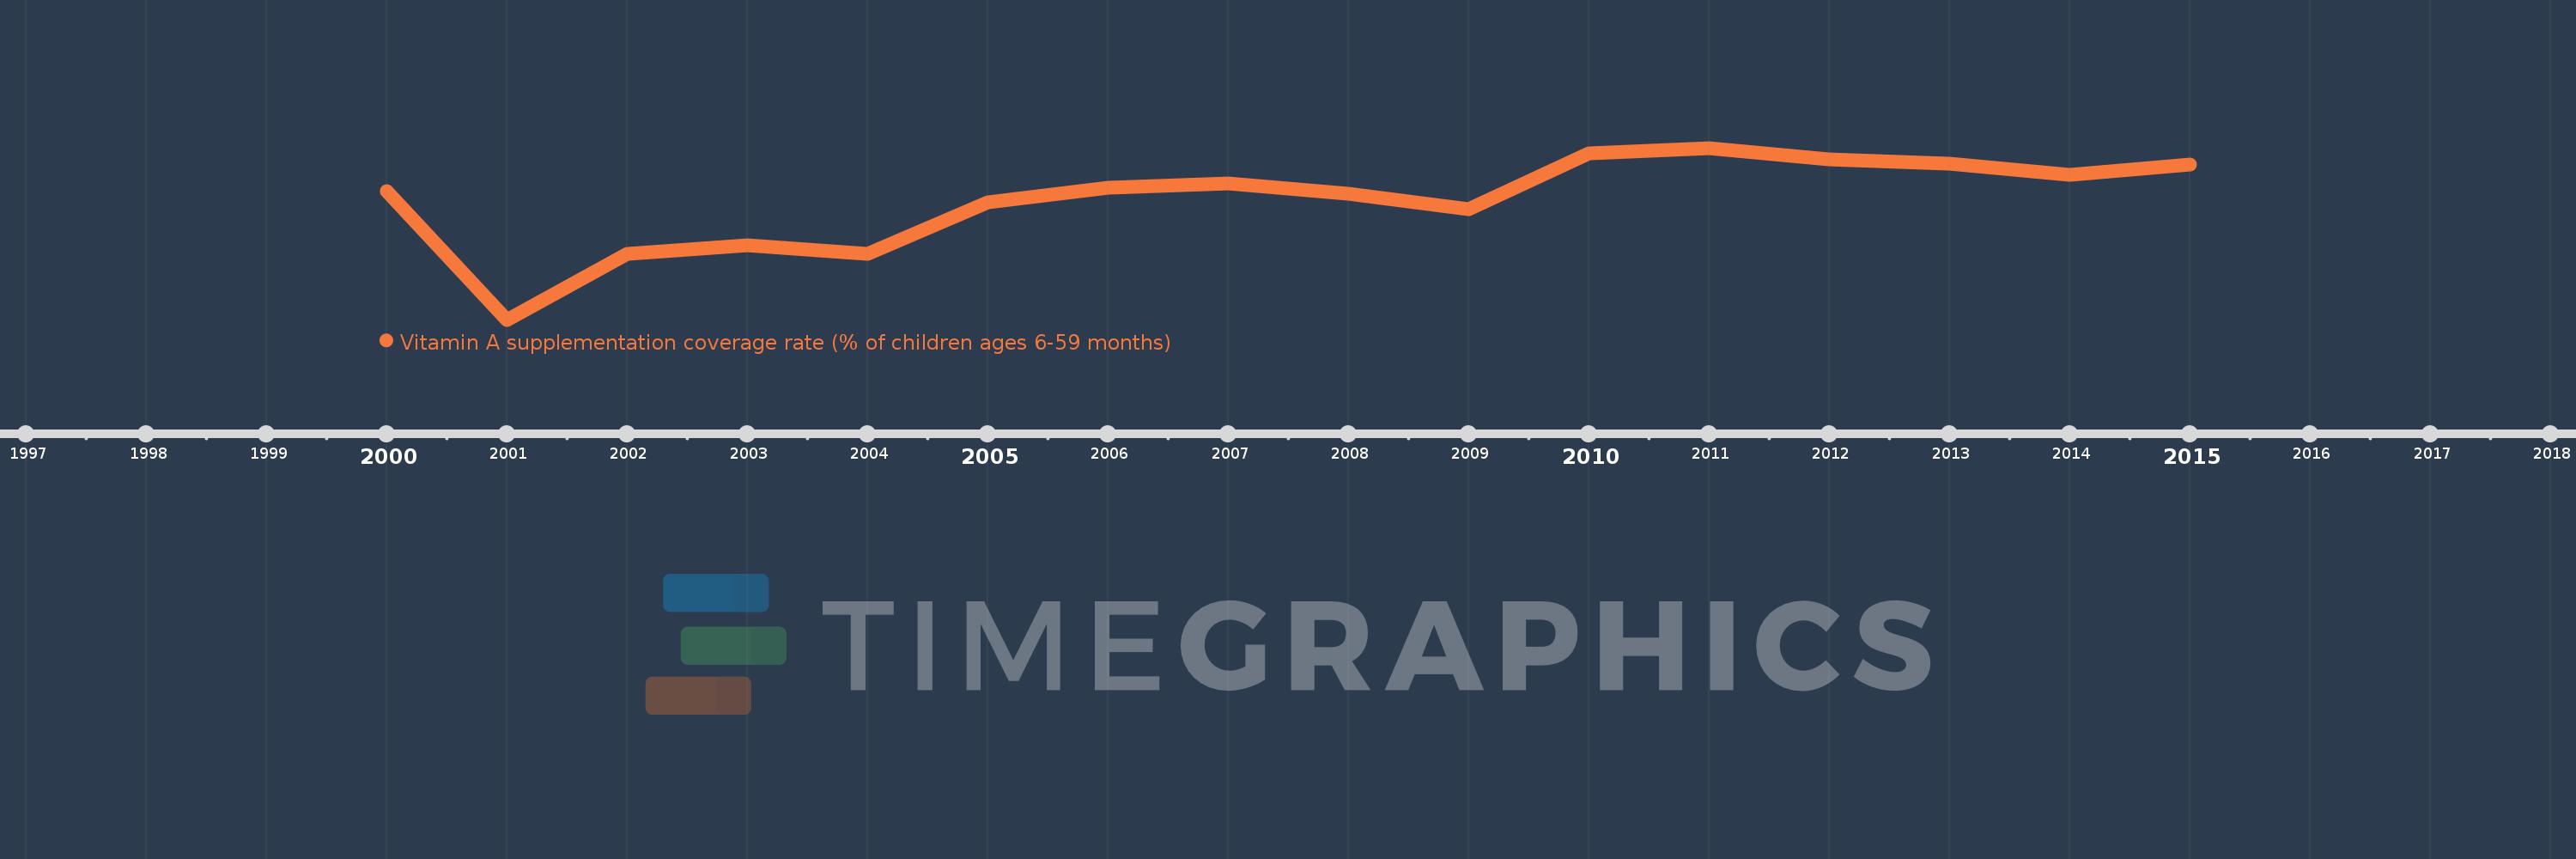
Vitamin A supplementation coverage rate (% of children ages 6-59 months)
2015,2014,2013,2012,2011,2010,2009,2008,2007,2006,2005,2004,2003,2002,2001,2000