33
/
AIzaSyB4mHJ5NPEv-XzF7P6NDYXjlkCWaeKw5bc
November 30, 2025
40439
IDA total
IDA
false
2
1
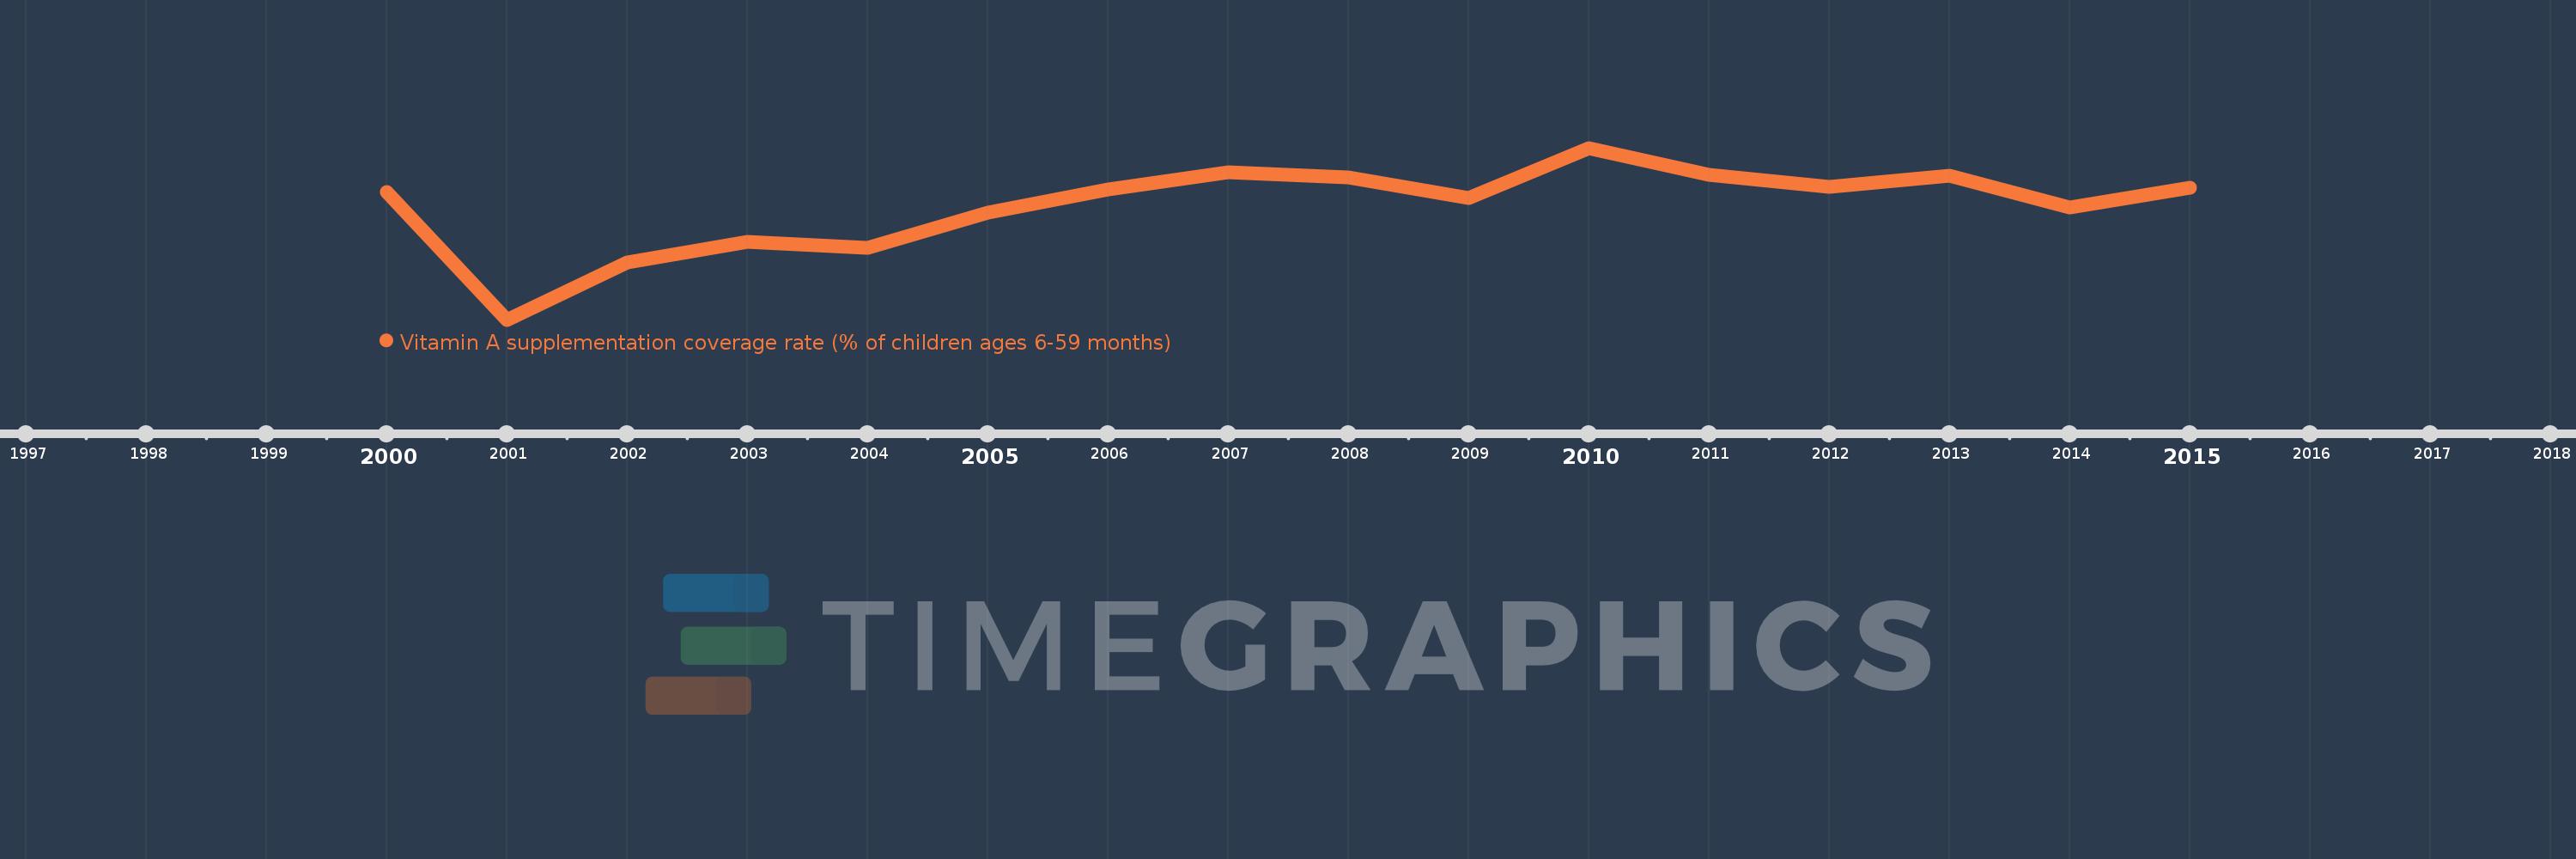
Vitamin A supplementation coverage rate (% of children ages 6-59 months)
2015,2014,2013,2012,2011,2010,2009,2008,2007,2006,2005,2004,2003,2002,2001,2000
Create a timeline
Public Timelines
For education
For educational institutions
For teachers
For students
Cabinet
For educational institutions
For teachers
For students
Open cabinet
FAQ
Close
Create a timeline
Public timelines
FAQ
About & Feedback
Terms
Privacy
FAQ
Support 24/7
Cabinet
Get premium
Donate
Download
Global statistics library
→
IDA total
→
Vitamin A supplementation coverage rate (% of children ages 6-59 months)
This statistics in other country:
Afghanistan
Angola
Azerbaijan
Bangladesh
Benin
Bhutan
Bolivia
Botswana
Brazil
Burkina Faso
Burundi
Cambodia
Cameroon
Central African Republic
Chad
Comoros
Congo, Dem. Rep.
Congo, Rep.
Costa Rica
Cote d'Ivoire
Djibouti
Dominican Republic
Early-demographic dividend
Ecuador
Egypt, Arab Rep.
El Salvador
Eritrea
Ethiopia
Fragile and conflict affected situations
Gabon
Gambia, The
Ghana
Guatemala
Guinea
Guinea-Bissau
Haiti
Heavily indebted poor countries (HIPC)
Honduras
IDA blend
IDA only
IDA total
India
Indonesia
Iraq
Kenya
Kiribati
Korea, Dem. People’s Rep.
Kyrgyz Republic
Lao PDR
Least developed countries: UN classification
Lesotho
Liberia
Low income
Lower middle income
Macedonia, FYR
Madagascar
Malawi
Maldives
Mali
Marshall Islands
Mauritania
Micronesia, Fed. Sts.
Mongolia
Mozambique
Myanmar
Namibia
Nepal
Nicaragua
Niger
Nigeria
Oman
Pakistan
Palau
Panama
Papua New Guinea
Peru
Philippines
Pre-demographic dividend
Rwanda
Sao Tome and Principe
Senegal
Sierra Leone
Somalia
South Africa
South Asia
South Asia (IDA & IBRD)
South Sudan
Sri Lanka
Sub-Saharan Africa
Sub-Saharan Africa (excluding high income)
Sub-Saharan Africa (IDA & IBRD countries)
Sudan
Swaziland
Syrian Arab Republic
Tajikistan
Tanzania
Timor-Leste
Togo
Uganda
Uzbekistan
Vietnam
Yemen, Rep.
Zambia
Zimbabwe
Timeline:
This timeline shows a graph from
2000
to
2015
of IDA total. No data until
1999
. Number of actual observations by date:
16
.
Source name:
World Development Indicators
Source organization:
United Nations Children's Fund, State of the World's Children.
Categories, topics:
Health
Last updated:
apr 23, 2017
Indicators value changes by year
Meaning:
68.651
Minimum:
38.737
jan 1, 2001
Maximum:
83.857
jan 1, 2010
At the date of observation
Value
Absolute change
Change from the previous value
jan 1, 2000
72.385
+72.385
0.0%
jan 1, 2001
38.737
-33.648
-46.48%
jan 1, 2002
53.854
+15.117
39.02%
jan 1, 2003
59.135
+5.281
9.81%
jan 1, 2004
57.716
-1.419
-2.4%
jan 1, 2005
66.916
+9.199
15.94%
jan 1, 2006
73.038
+6.122
9.15%
jan 1, 2007
77.411
+4.373
5.99%
jan 1, 2008
76.117
-1.294
-1.67%
jan 1, 2009
70.661
-5.456
-7.17%
jan 1, 2010
83.857
+13.196
18.67%
jan 1, 2011
76.77
-7.087
-8.45%
jan 1, 2012
73.55
-3.22
-4.19%
jan 1, 2013
76.67
+3.12
4.24%
jan 1, 2014
68.261
-8.409
-10.97%
jan 1, 2015
73.338
+5.078
7.44%
Ranking of countries by current statistics by years
About & Feedback
Terms
Privacy
FAQ
Support 24/7
Cabinet
Get premium
Donate
The service accepts bank transfer (ACH, Wire) or cards (Visa, MasterCard, etc). Processed by Stripe.
Secured with SSL