33
/
AIzaSyB4mHJ5NPEv-XzF7P6NDYXjlkCWaeKw5bc
November 30, 2025
55689
Pre-demographic dividend
PRE
false
2
1
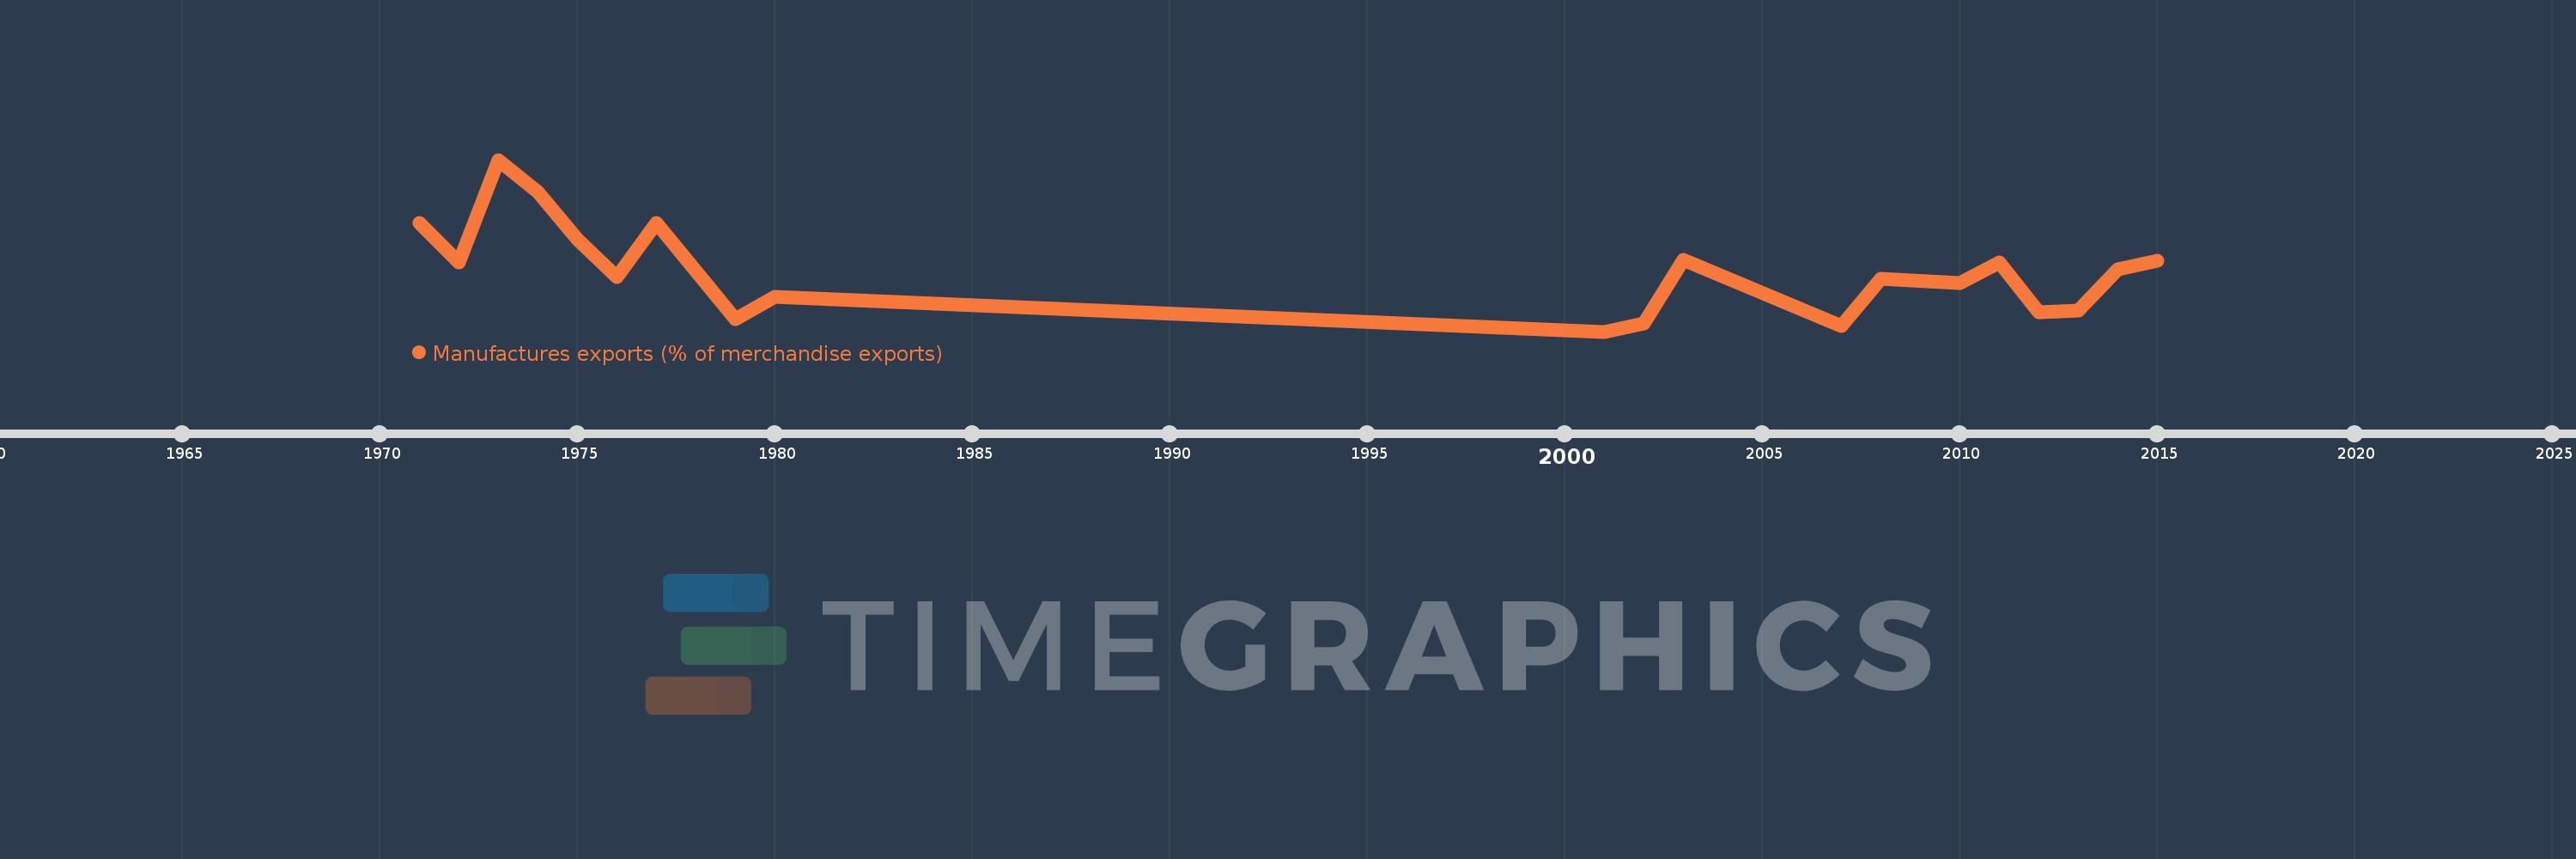
Manufactures exports (% of merchandise exports)
2015,2014,2013,2012,2011,2010,2008,2007,2003,2002,2001,1980,1979,1977,1976,1975,1974,1973,1972,1971