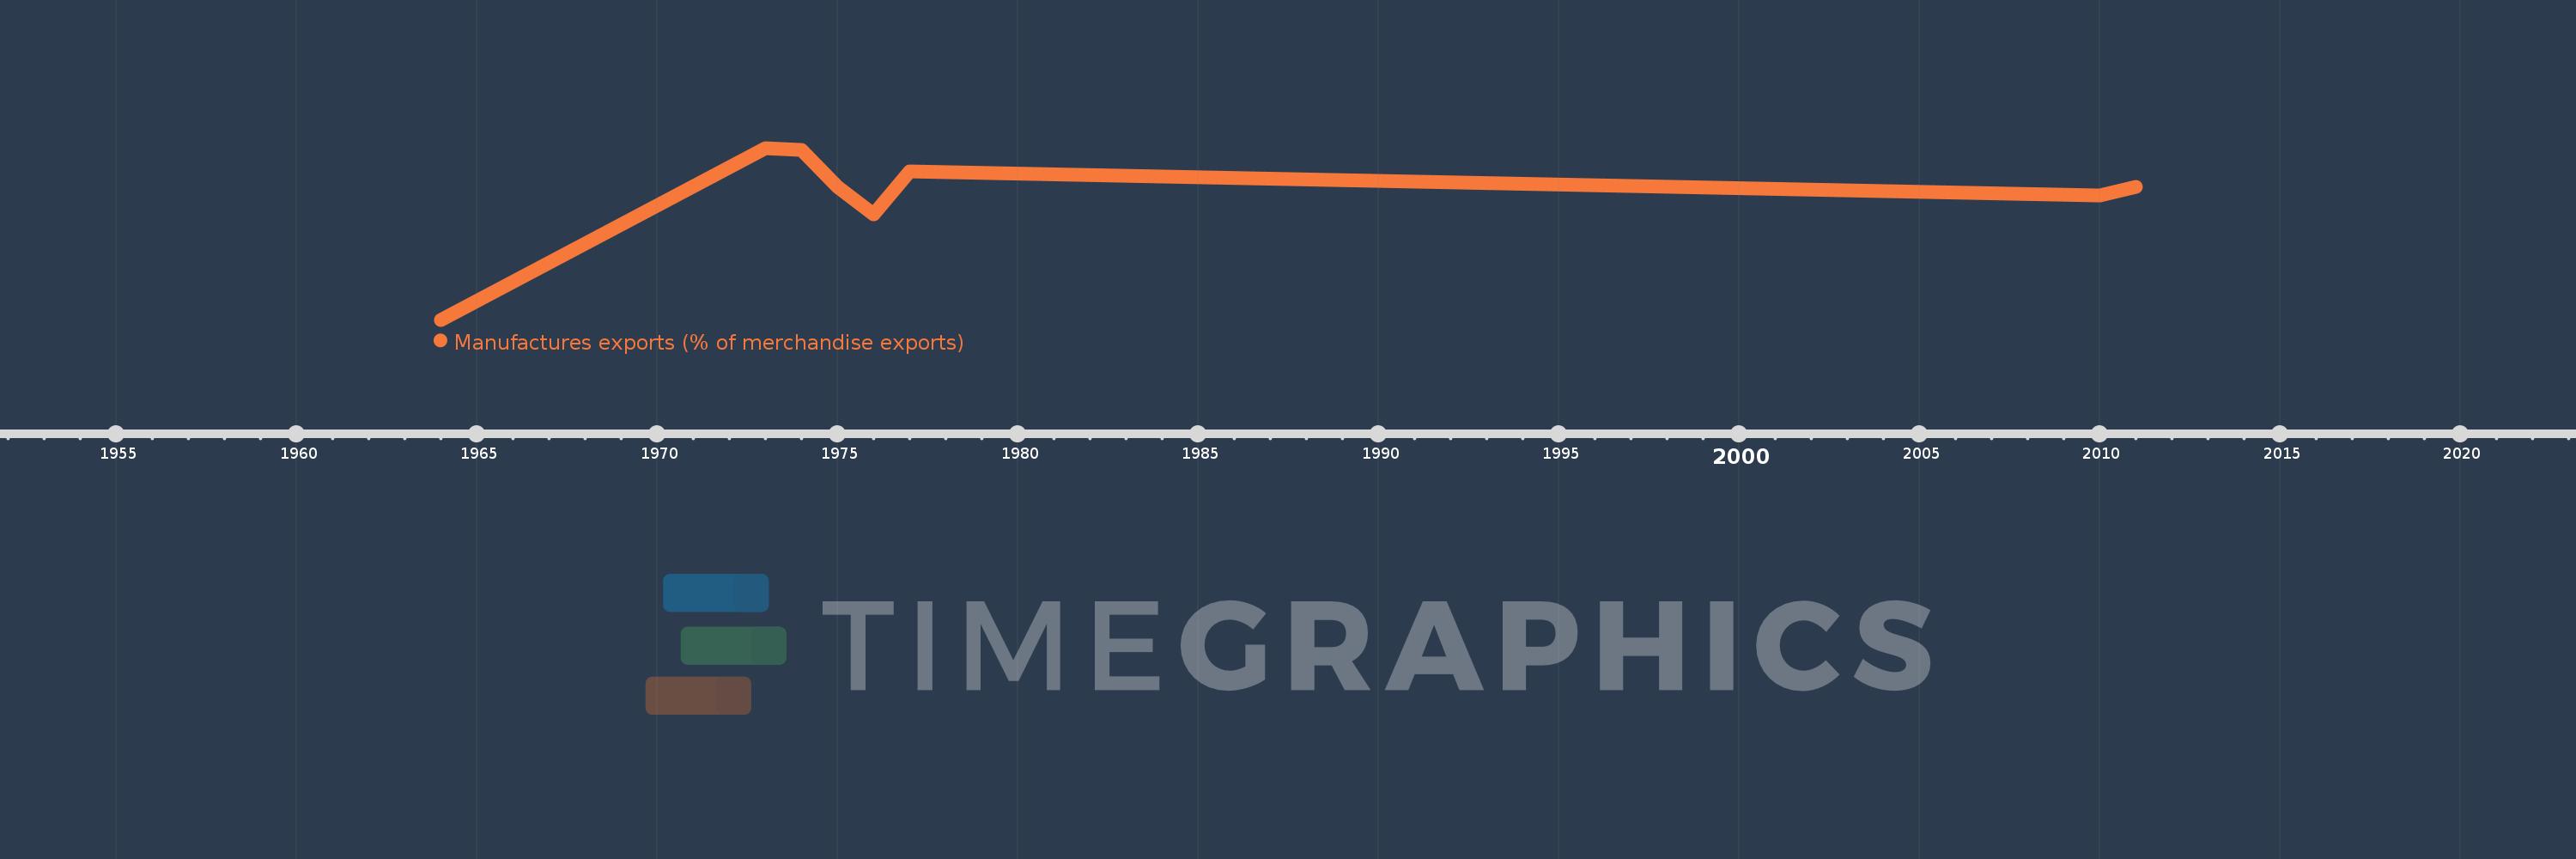
This timeline shows a graph from 1964 to 2011 of Fragile and conflict affected situations. No data until 1963. Number of actual observations by date: 8.
Source name:
World Development Indicators
Source organization:
World Bank staff estimates from the Comtrade database maintained by the United Nations Statistics Division.
Categories, topics:
Private Sector, Trade
Last updated:
apr 23, 2017
Indicators value changes by year
Meaning:
8.365
Minimum:
0.879
jan 1, 1964
Maximum:
11.317
jan 1, 1973
At the date of observation
Value
Absolute change
Change from the previous value
jan 1, 1964
0.879
+0.879
0.0%
jan 1, 1973
11.317
+10.438
1.19K%
jan 1, 1974
11.217
-0.1
-0.89%
jan 1, 1975
8.927
-2.29
-20.42%
jan 1, 1976
7.299
-1.627
-18.23%
jan 1, 1977
9.881
+2.582
35.37%
jan 1, 2010
8.433
-1.448
-14.65%
jan 1, 2011
8.968
+0.535
6.35%
Ranking of countries by current statistics by years