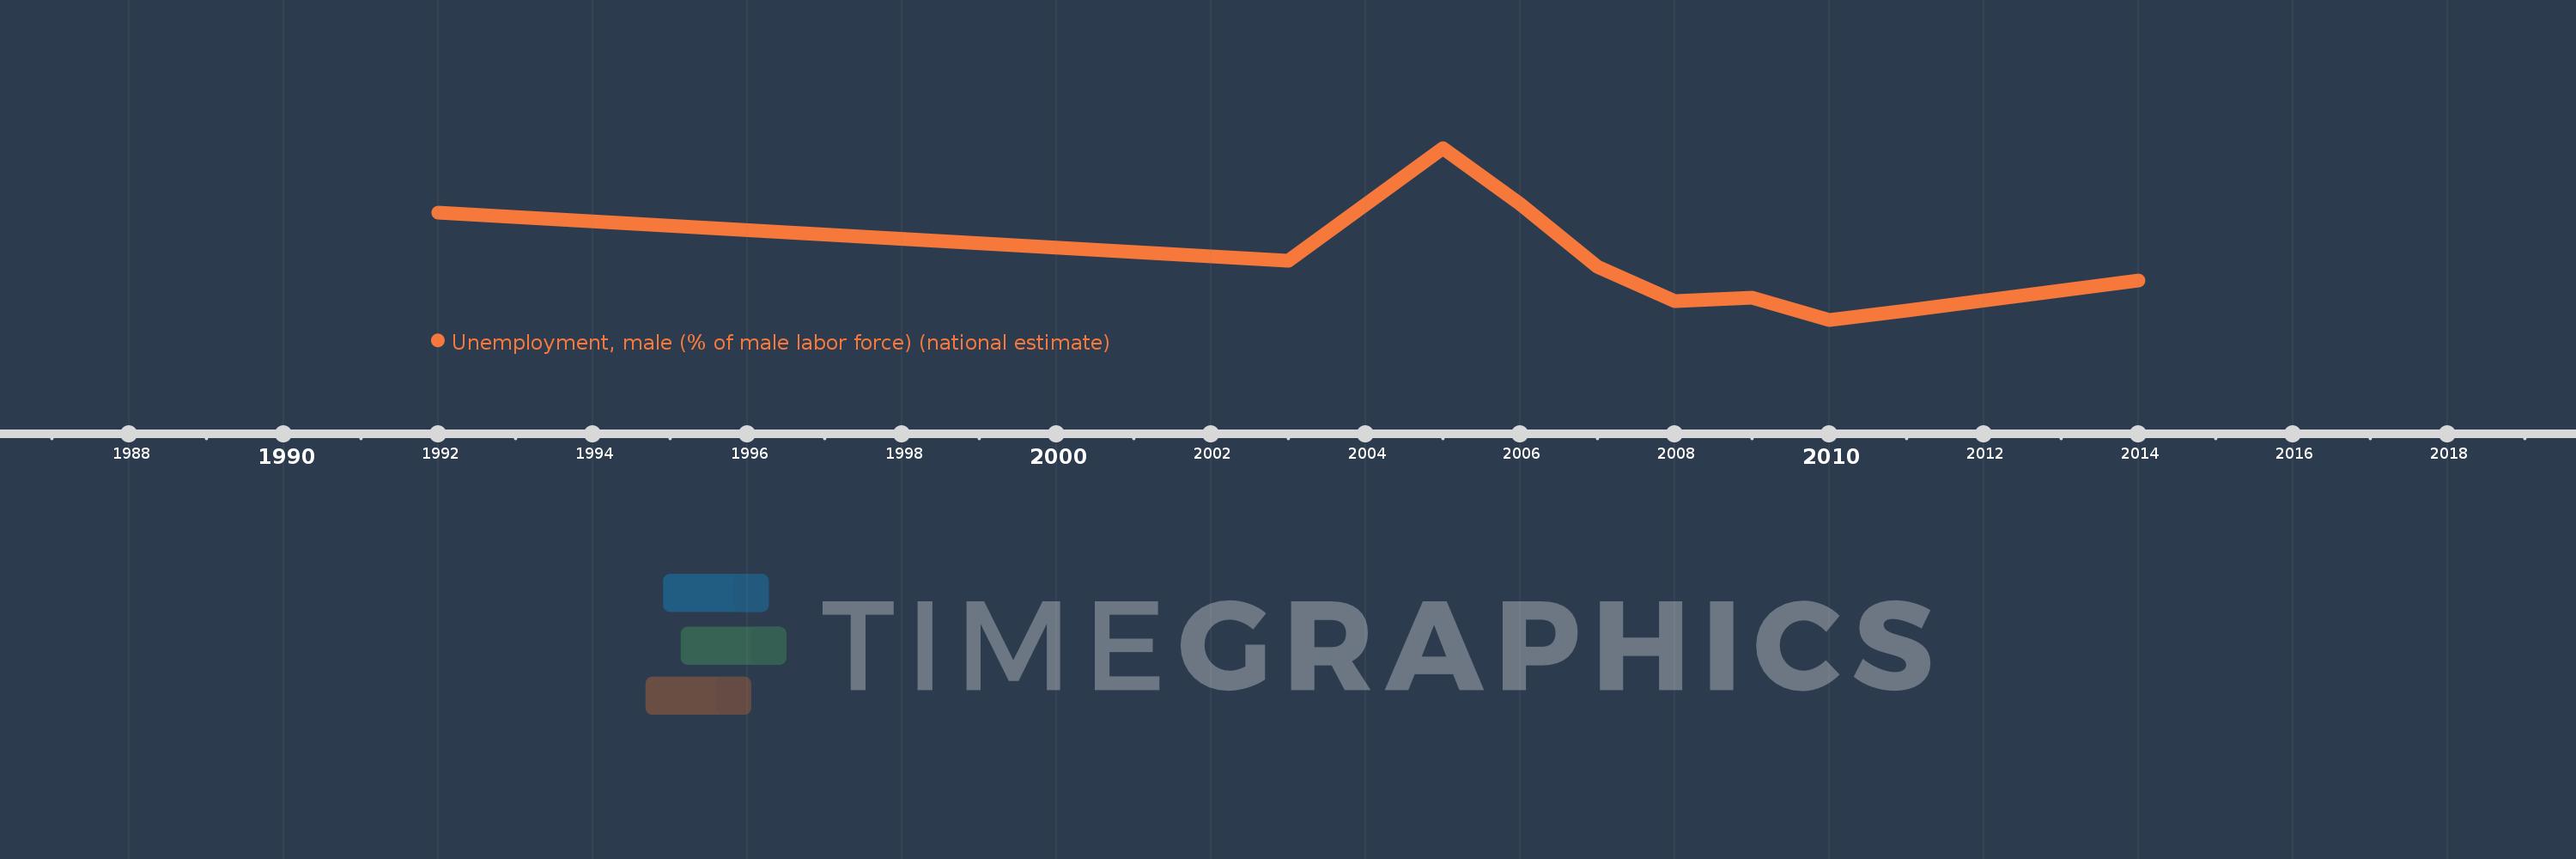
This timeline shows a graph from 1992 to 2014 of Middle East & North Africa (IDA & IBRD countries). No data until 1991. Number of actual observations by date: 10.
Source name:
World Development Indicators
Source organization:
International Labour Organization, Key Indicators of the Labour Market database.
Categories, topics:
Social Protection & Labor
Last updated:
apr 23, 2017
Indicators value changes by year
Meaning:
9.759
Minimum:
8.423
jan 1, 2010
Maximum:
12.272
jan 1, 2005
At the date of observation
Value
Absolute change
Change from the previous value
jan 1, 1992
10.814
+10.814
0.0%
jan 1, 2003
9.747
-1.068
-9.87%
jan 1, 2005
12.272
+2.526
25.92%
jan 1, 2006
11.024
-1.248
-10.17%
jan 1, 2007
9.605
-1.419
-12.87%
jan 1, 2008
8.846
-0.759
-7.9%
jan 1, 2009
8.922
+0.076
0.86%
jan 1, 2010
8.423
-0.499
-5.59%
jan 1, 2011
8.635
+0.211
2.51%
jan 1, 2014
9.298
+0.664
7.69%
Ranking of countries by current statistics by years