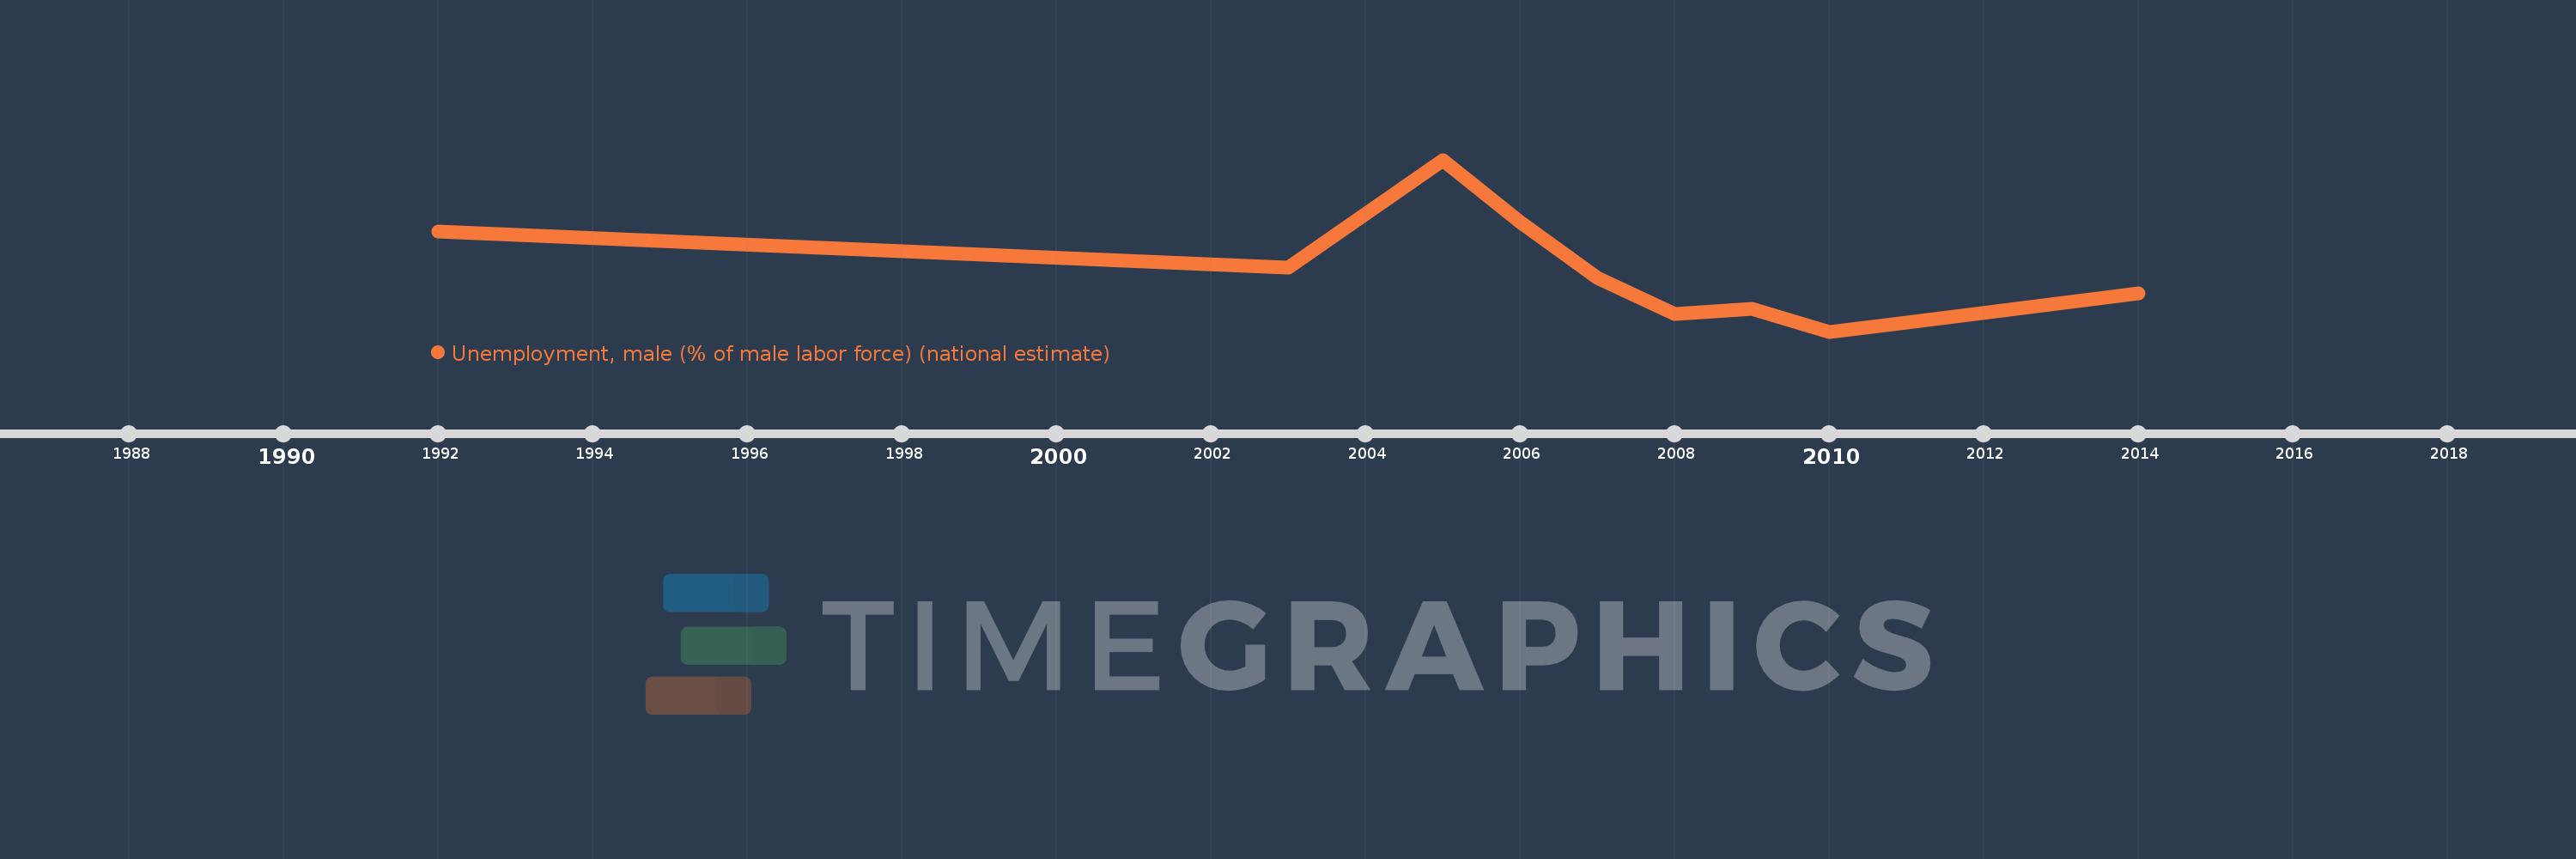
This timeline shows a graph from 1992 to 2014 of Middle East & North Africa (excluding high income). No data until 1991. Number of actual observations by date: 10.
Source name:
World Development Indicators
Source organization:
International Labour Organization, Key Indicators of the Labour Market database.
Categories, topics:
Social Protection & Labor
Last updated:
apr 23, 2017
Indicators value changes by year
Meaning:
9.887
Minimum:
8.577
jan 1, 2010
Maximum:
12.41
jan 1, 2005
At the date of observation
Value
Absolute change
Change from the previous value
jan 1, 1992
10.814
+10.814
0.0%
jan 1, 2003
9.997
-0.818
-7.56%
jan 1, 2005
12.41
+2.413
24.14%
jan 1, 2006
11.024
-1.386
-11.17%
jan 1, 2007
9.781
-1.244
-11.28%
jan 1, 2008
8.971
-0.809
-8.27%
jan 1, 2009
9.085
+0.113
1.26%
jan 1, 2010
8.577
-0.507
-5.58%
jan 1, 2011
8.778
+0.201
2.34%
jan 1, 2014
9.434
+0.656
7.47%
Ranking of countries by current statistics by years