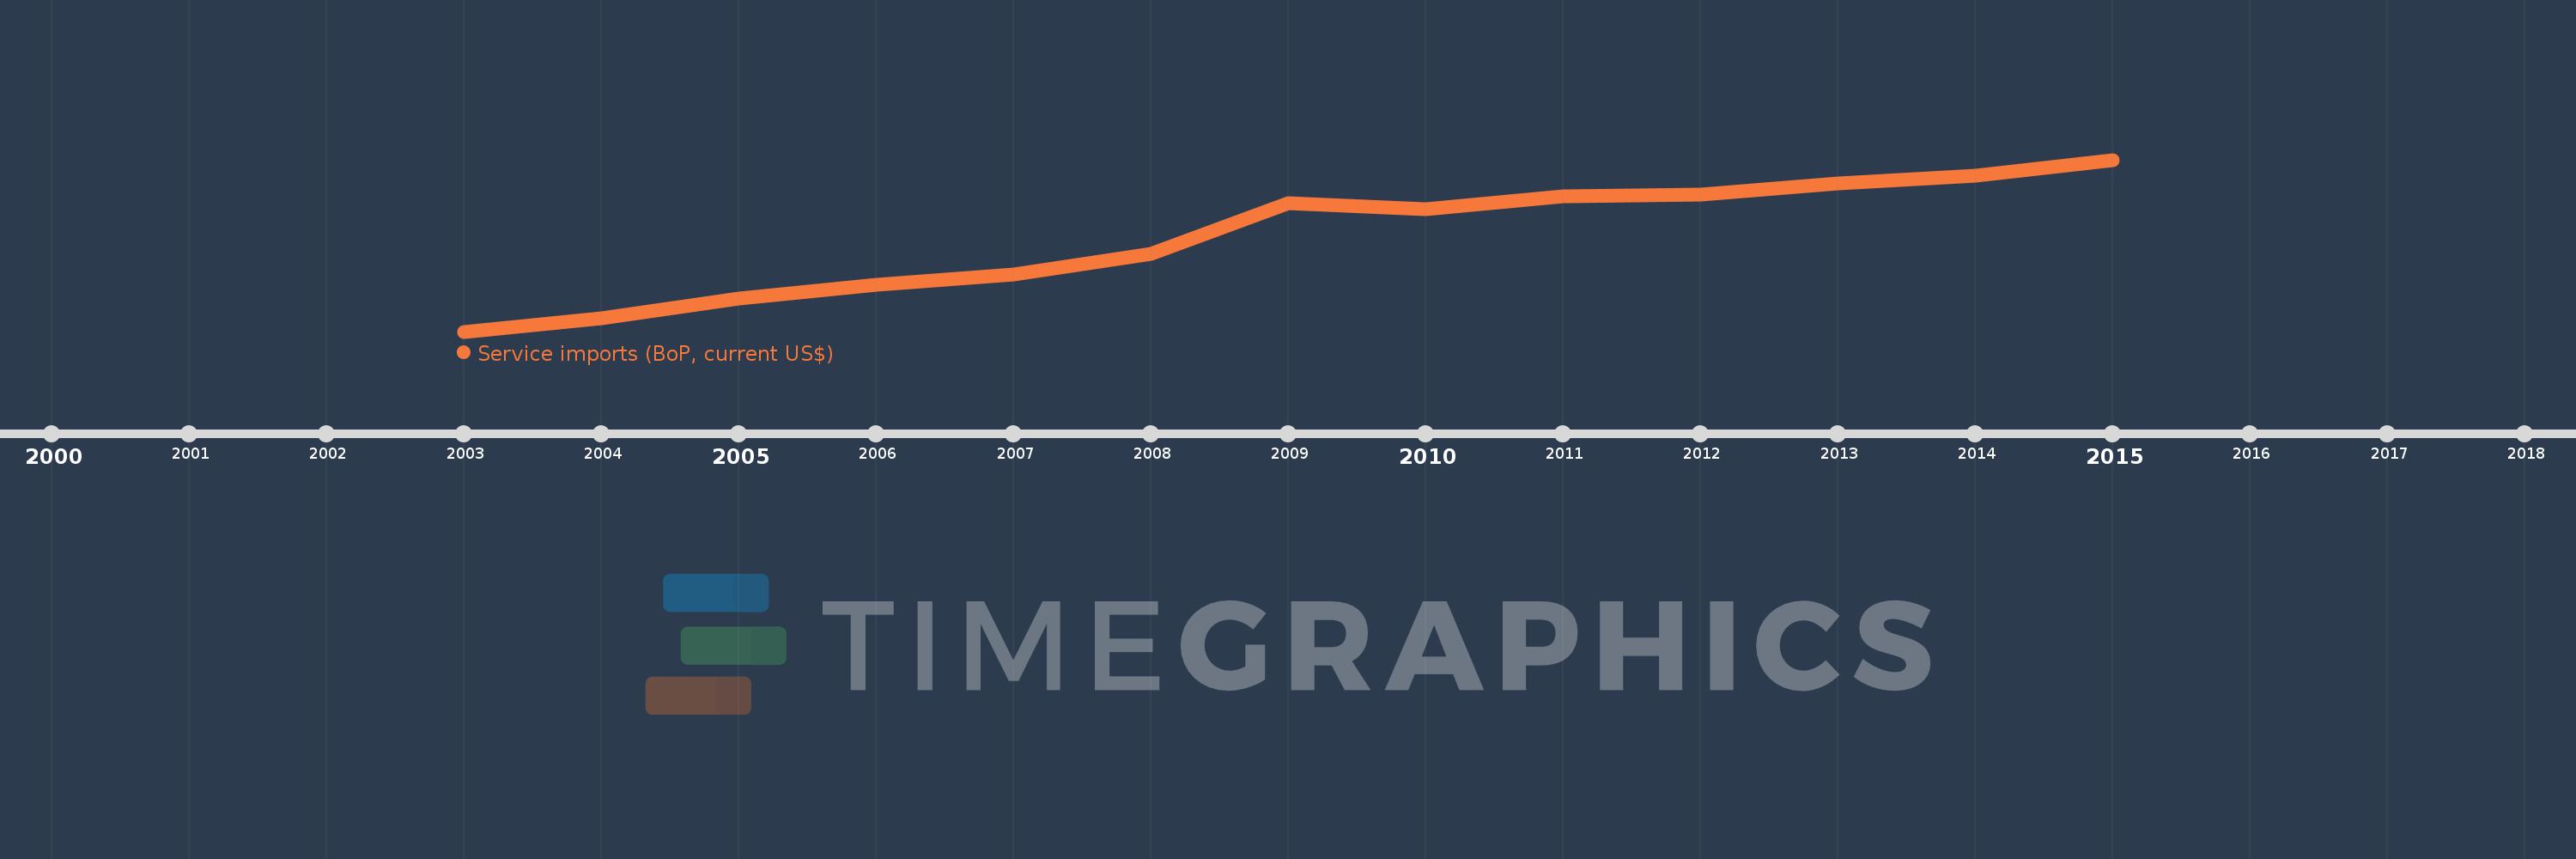
This timeline shows a graph from 2003 to 2015 of Middle East & North Africa (IDA & IBRD countries). No data until 2002. Number of actual observations by date: 13.
Source name:
World Development Indicators
Source organization:
International Monetary Fund, Balance of Payments Statistics Yearbook and data files.
Categories, topics:
Economy & Growth, Trade
Last updated:
apr 23, 2017
Indicators value changes by year
Meaning:
76.017 bln
Minimum:
32.822 bln
jan 1, 2003
Maximum:
111.422 bln
jan 1, 2015
At the date of observation
Value
Absolute change
Change from the previous value
jan 1, 2003
32.822 bln
+32.822 bln
0.0%
jan 1, 2004
38.946 bln
+6.124 bln
18.66%
jan 1, 2005
47.952 bln
+9.006 bln
23.12%
jan 1, 2006
54.316 bln
+6.364 bln
13.27%
jan 1, 2007
58.798 bln
+4.482 bln
8.25%
jan 1, 2008
68.438 bln
+9.64 bln
16.4%
jan 1, 2009
91.409 bln
+22.971 bln
33.57%
jan 1, 2010
88.962 bln
-2.447 bln
-2.68%
jan 1, 2011
94.679 bln
+5.717 bln
6.43%
jan 1, 2012
95.693 bln
+1.013 bln
1.07%
jan 1, 2013
100.561 bln
+4.868 bln
5.09%
jan 1, 2014
104.226 bln
+3.665 bln
3.64%
jan 1, 2015
111.422 bln
+7.196 bln
6.9%
Ranking of countries by current statistics by years