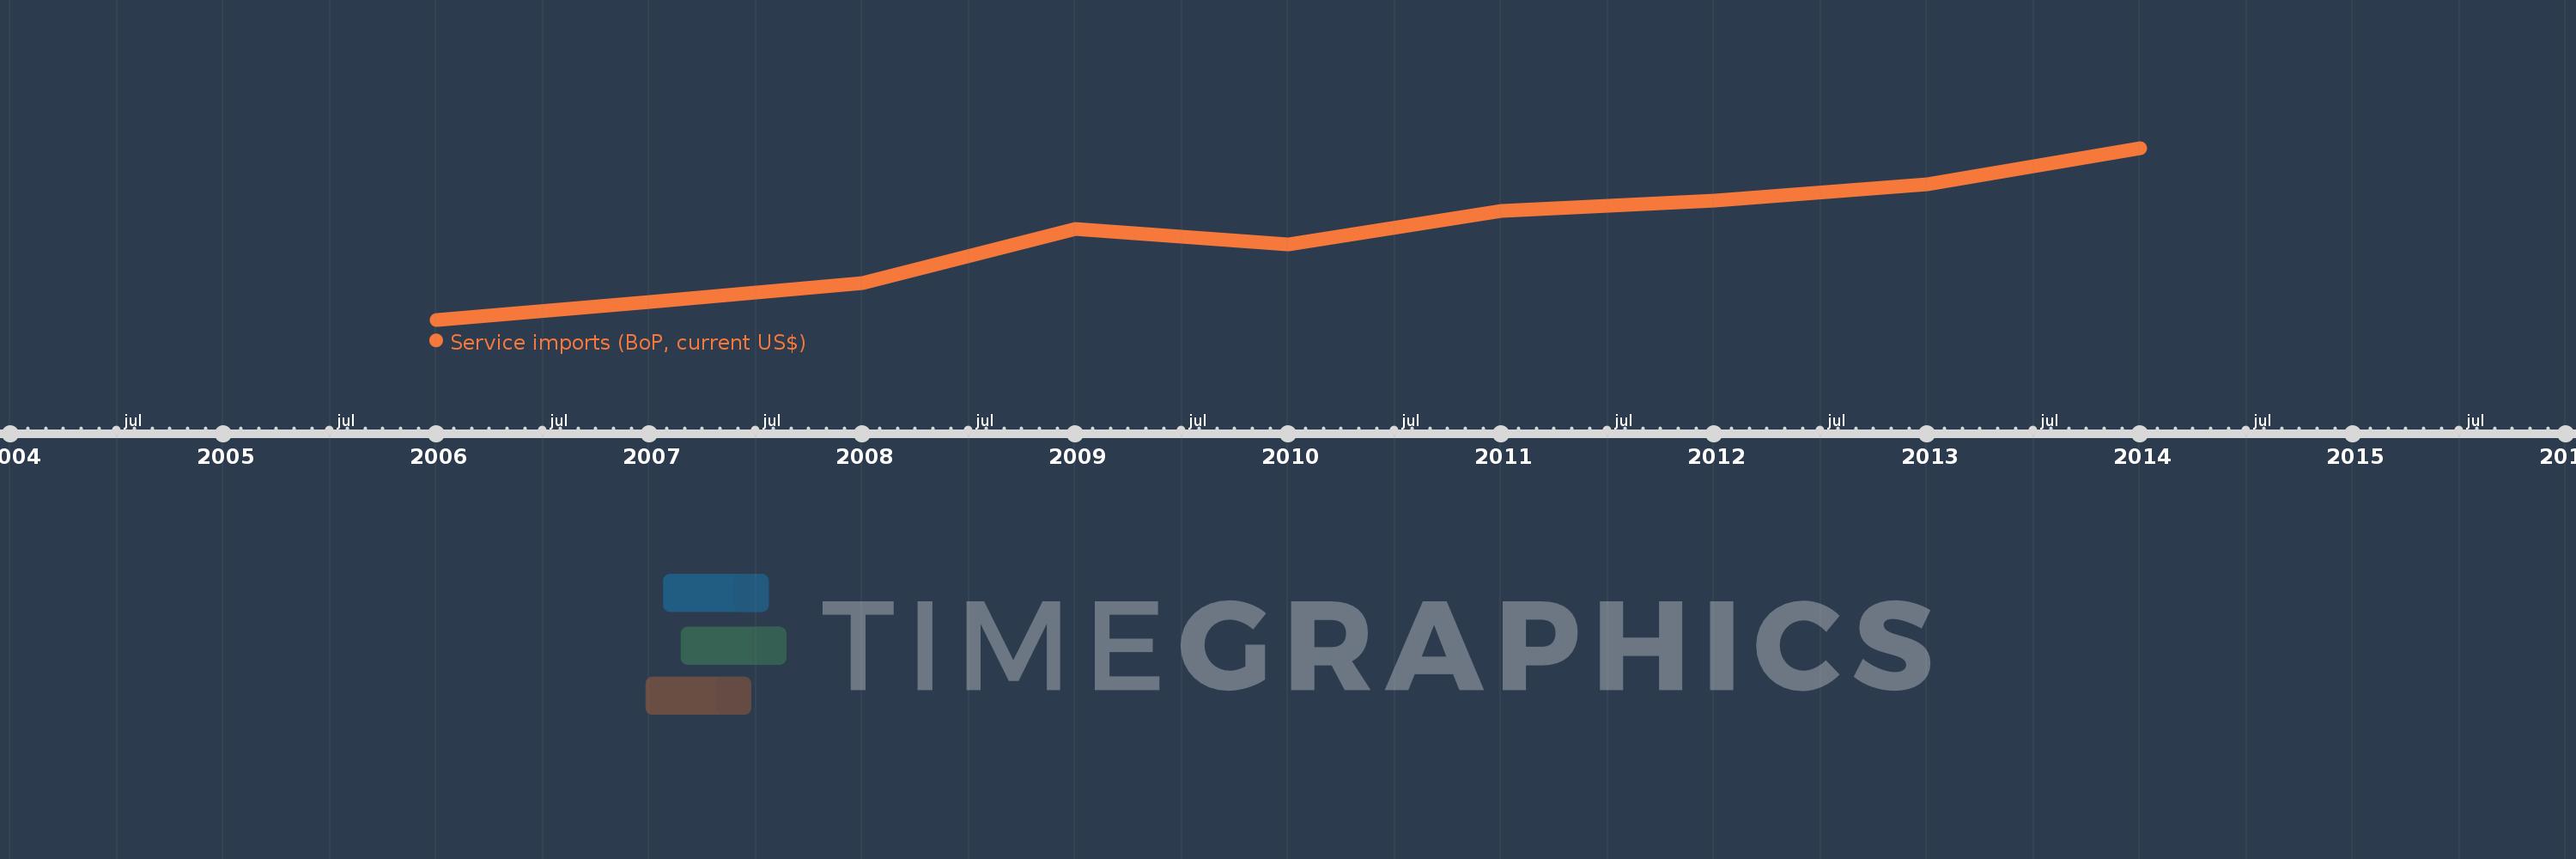
This timeline shows a graph from 2006 to 2014 of Fragile and conflict affected situations. No data until 2005. Number of actual observations by date: 9.
Source name:
World Development Indicators
Source organization:
International Monetary Fund, Balance of Payments Statistics Yearbook and data files.
Categories, topics:
Economy & Growth, Trade
Last updated:
apr 23, 2017
Indicators value changes by year
Meaning:
54.133 bln
Minimum:
35.762 bln
jan 1, 2006
Maximum:
73.357 bln
jan 1, 2014
At the date of observation
Value
Absolute change
Change from the previous value
jan 1, 2006
35.762 bln
+35.762 bln
0.0%
jan 1, 2007
39.618 bln
+3.856 bln
10.78%
jan 1, 2008
43.832 bln
+4.215 bln
10.64%
jan 1, 2009
55.541 bln
+11.709 bln
26.71%
jan 1, 2010
52.241 bln
-3.3 bln
-5.94%
jan 1, 2011
59.648 bln
+7.407 bln
14.18%
jan 1, 2012
61.79 bln
+2.141 bln
3.59%
jan 1, 2013
65.408 bln
+3.618 bln
5.86%
jan 1, 2014
73.357 bln
+7.95 bln
12.15%
Ranking of countries by current statistics by years