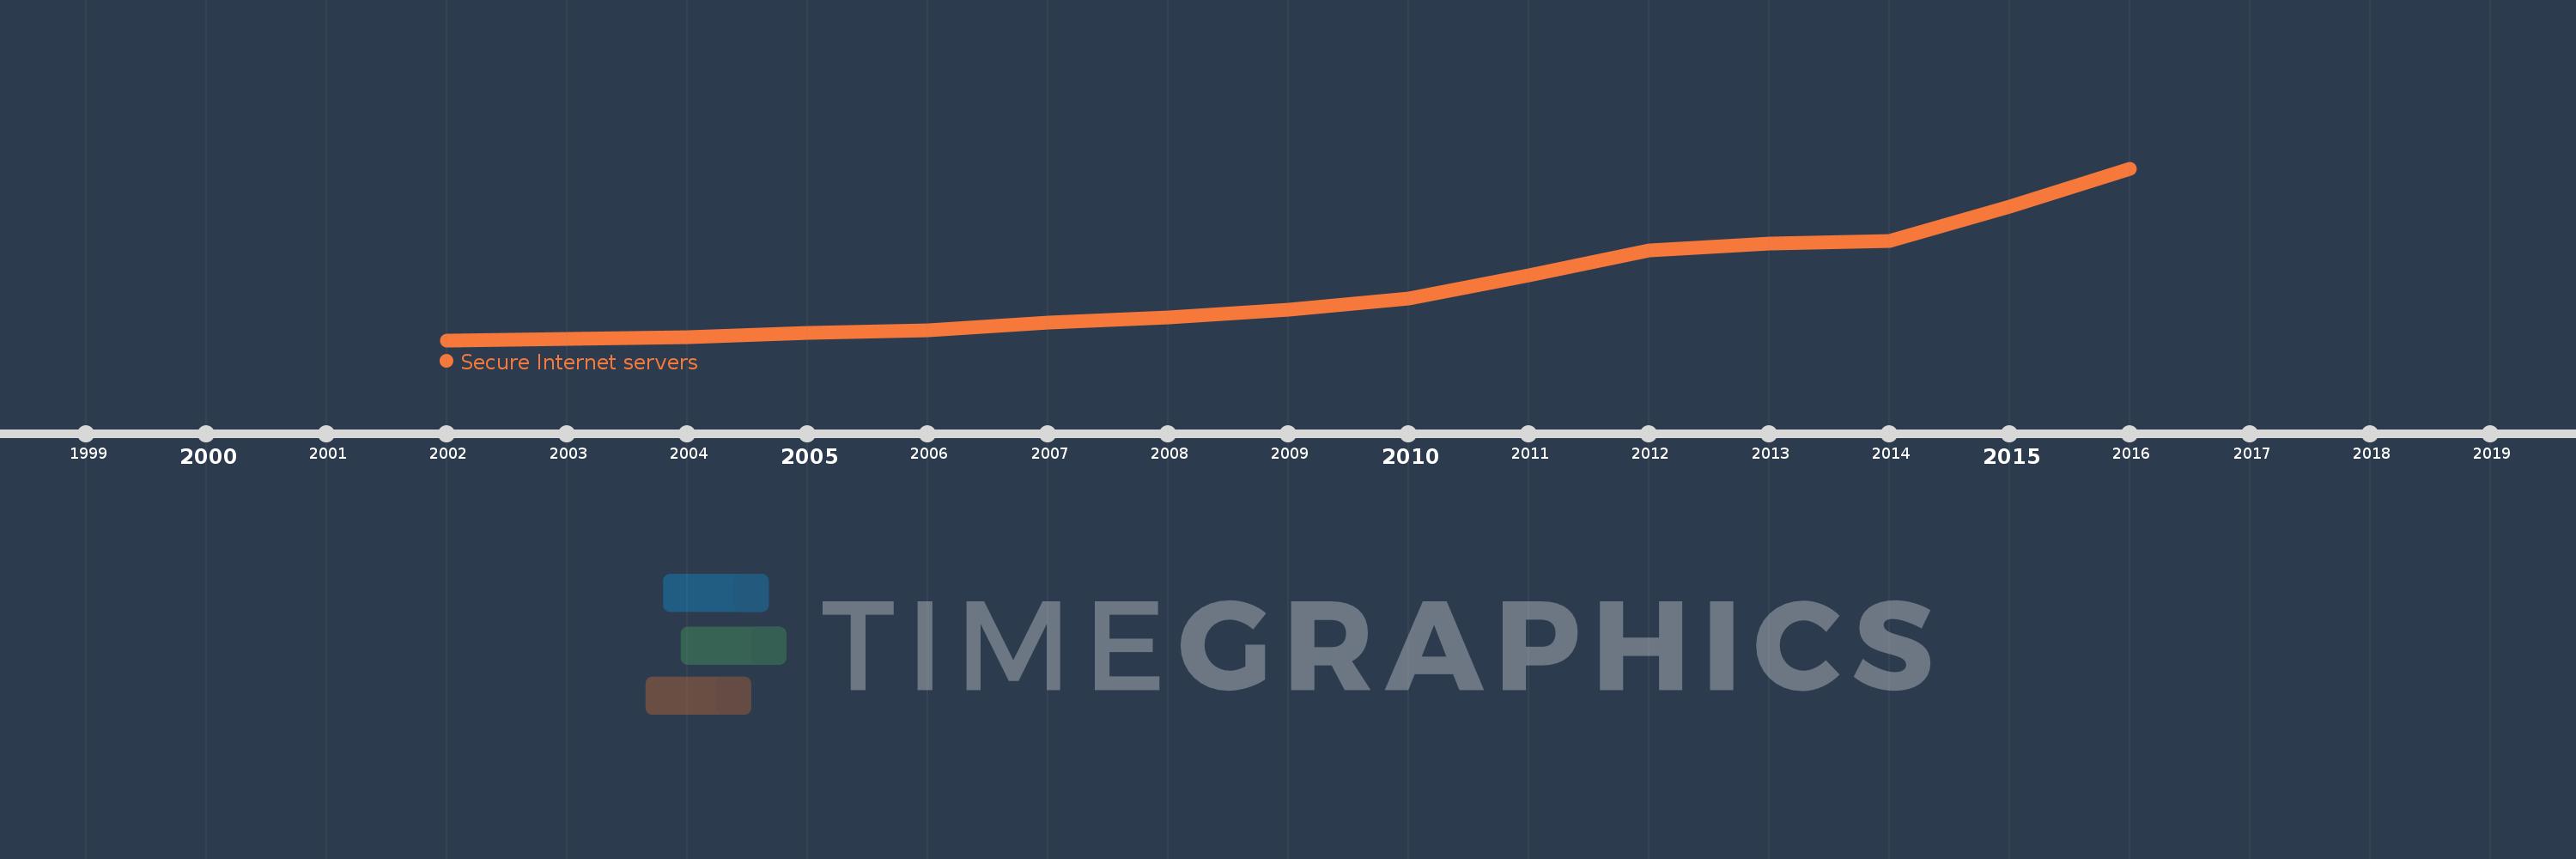
This timeline shows a graph from 2002 to 2016 of Middle East & North Africa (IDA & IBRD countries). No data until 2001. Number of actual observations by date: 14.
Source name:
World Development Indicators
Source organization:
Netcraft (http://www.netcraft.com/).
Categories, topics:
Infrastructure
Last updated:
apr 23, 2017
Indicators value changes by year
Meaning:
685.771
Minimum:
43.0
jan 1, 2002
Maximum:
2.001K
jan 1, 2016
At the date of observation
Value
Absolute change
Change from the previous value
jan 1, 2002
43.0
+43.0
0.0%
jan 1, 2004
76.0
+33.0
76.74%
jan 1, 2005
131.0
+55.0
72.37%
jan 1, 2006
155.0
+24.0
18.32%
jan 1, 2007
239.8
+84.8
54.71%
jan 1, 2008
303.0
+63.2
26.36%
jan 1, 2009
394.0
+91.0
30.03%
jan 1, 2010
518.0
+124.0
31.47%
jan 1, 2011
784.0
+266.0
51.35%
jan 1, 2012
1.067K
+283.0
36.1%
jan 1, 2013
1.146K
+79.0
7.4%
jan 1, 2014
1.174K
+28.0
2.44%
jan 1, 2015
1.569K
+395.0
33.65%
jan 1, 2016
2.001K
+432.0
27.53%
Ranking of countries by current statistics by years