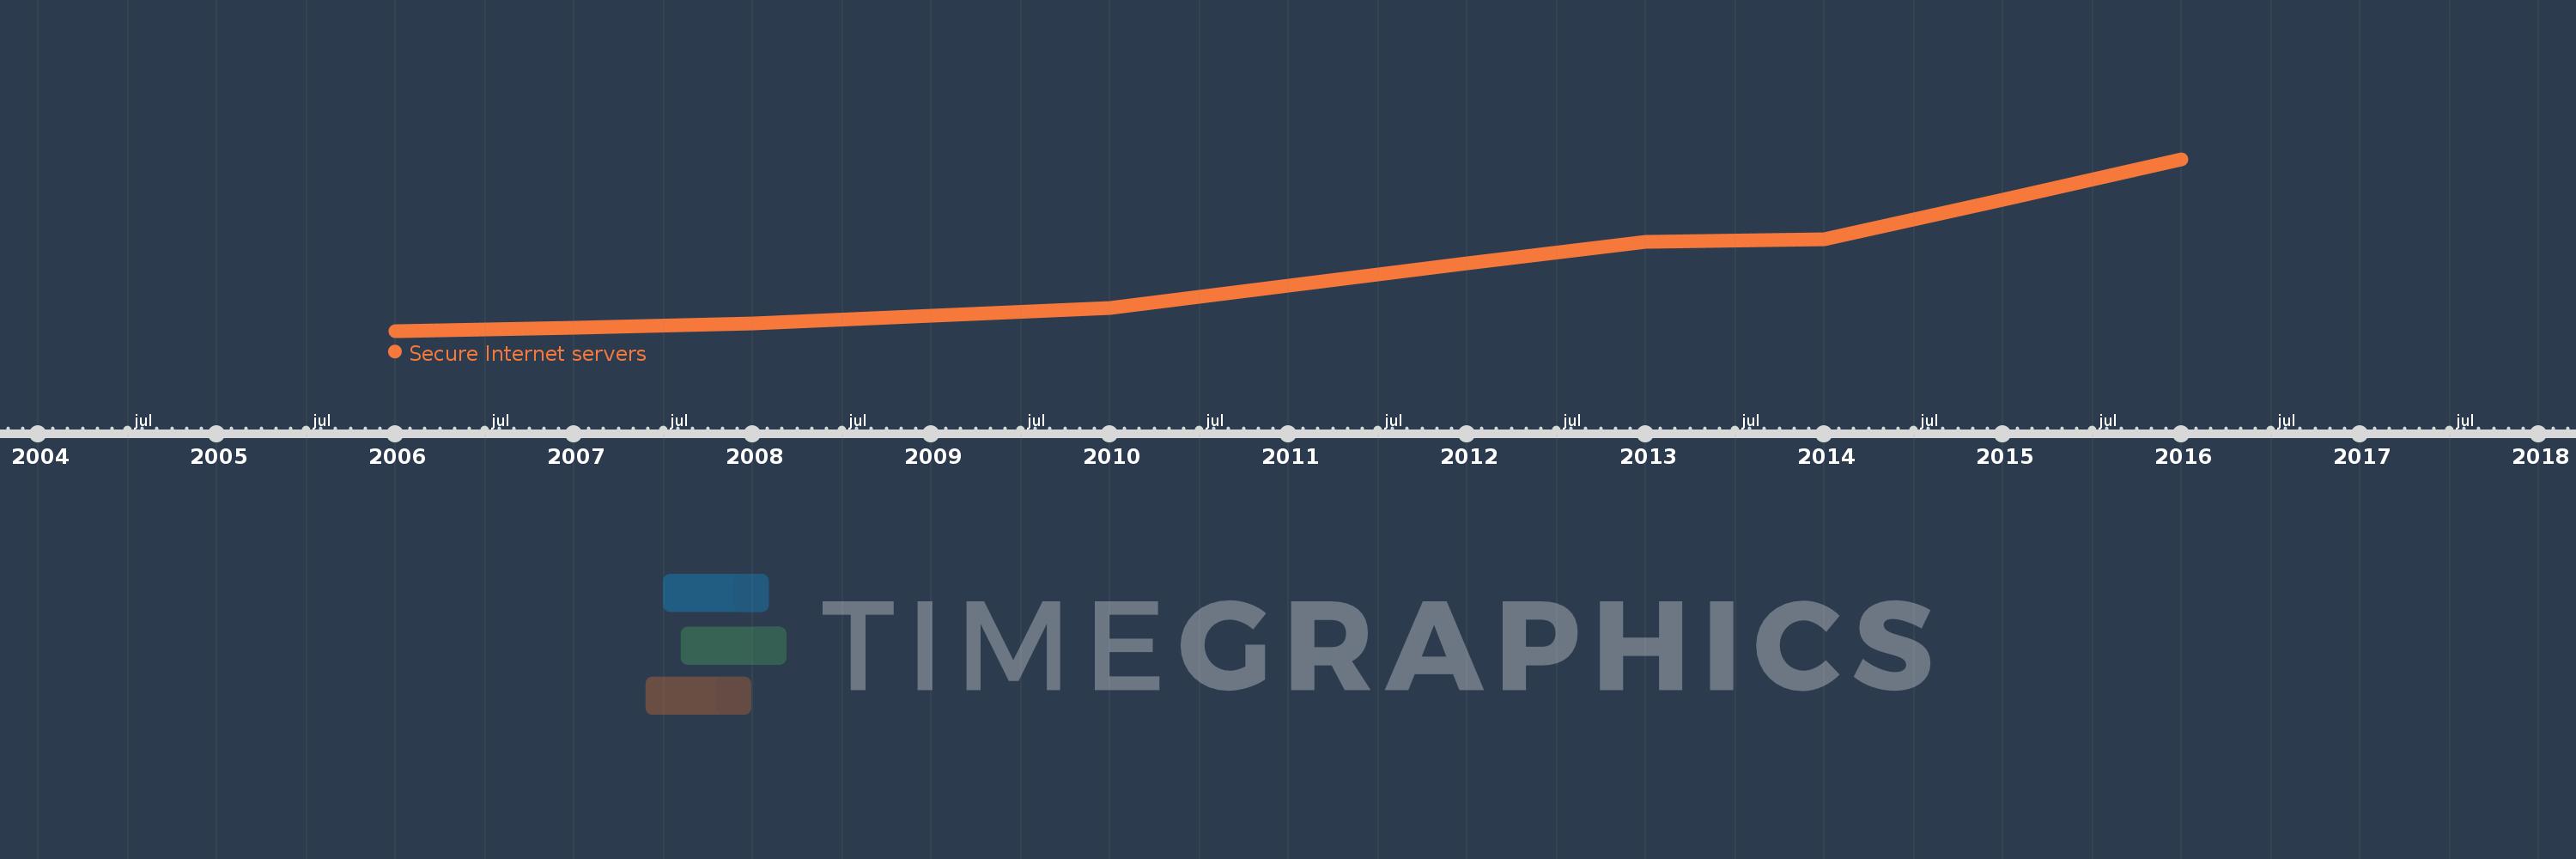
This timeline shows a graph from 2006 to 2016 of Fragile and conflict affected situations. No data until 2005. Number of actual observations by date: 11.
Source name:
World Development Indicators
Source organization:
Netcraft (http://www.netcraft.com/).
Categories, topics:
Infrastructure
Last updated:
apr 23, 2017
Indicators value changes by year
Meaning:
393.818
Minimum:
75.0
jan 1, 2006
Maximum:
1.007K
jan 1, 2016
At the date of observation
Value
Absolute change
Change from the previous value
jan 1, 2006
75.0
+75.0
0.0%
jan 1, 2007
93.0
+18.0
24.0%
jan 1, 2008
117.0
+24.0
25.81%
jan 1, 2009
157.0
+40.0
34.19%
jan 1, 2010
198.0
+41.0
26.11%
jan 1, 2011
321.0
+123.0
62.12%
jan 1, 2012
444.0
+123.0
38.32%
jan 1, 2013
560.0
+116.0
26.13%
jan 1, 2014
574.0
+14.0
2.5%
jan 1, 2015
786.0
+212.0
36.93%
jan 1, 2016
1.007K
+221.0
28.12%
Ranking of countries by current statistics by years