33
/
AIzaSyAYiBZKx7MnpbEhh9jyipgxe19OcubqV5w
August 1, 2025
50331
Middle East & North Africa (IDA & IBRD countries)
TMN
false
2
1
Other taxes (% of revenue)
2010,2009,2008,2007,2006,2005,2004,2003,2002,2001,2000,1999,1998,1997,1996,1995,1994,1993,1992,1991
Download
Global statistics library →Middle East & North Africa (IDA & IBRD countries) →

Other taxes (% of revenue)

This statistics in other country:

AfghanistanAlbaniaAlgeriaAngolaAntigua and BarbudaArab WorldArgentinaArmeniaAustraliaAustriaAzerbaijanBahamas, TheBahrainBangladeshBarbadosBelarusBelgiumBelizeBeninBhutanBoliviaBosnia and HerzegovinaBotswanaBrazilBulgariaBurkina FasoBurundiCabo VerdeCambodiaCaribbean small statesCentral African RepublicCentral Europe and the BalticsChileChinaColombiaCongo, Dem. Rep.Congo, Rep.Costa RicaCote d'IvoireCroatiaCyprusCzech RepublicDenmarkDominicaDominican RepublicEarly-demographic dividendEast Asia & PacificEast Asia & Pacific (excluding high income)East Asia & Pacific (IDA & IBRD countries)Egypt, Arab Rep.El SalvadorEquatorial GuineaEstoniaEthiopiaEuro areaEurope & Central AsiaEurope & Central Asia (excluding high income)Europe & Central Asia (IDA & IBRD countries)European UnionFijiFinlandFranceGambia, TheGeorgiaGermanyGreeceGrenadaGuatemalaHeavily indebted poor countries (HIPC)High incomeHondurasHong Kong SAR, ChinaHungaryIBRD onlyIcelandIDA & IBRD totalIDA blendIDA onlyIDA totalIndiaIndonesiaIran, Islamic Rep.IraqIrelandIsraelItalyJamaicaJapanJordanKazakhstanKenyaKiribatiKorea, Rep.KuwaitKyrgyz RepublicLao PDRLate-demographic dividendLatin America & Caribbean Latin America & Caribbean (excluding high income)Latin America & the Caribbean (IDA & IBRD countries)LatviaLeast developed countries: UN classificationLebanonLesothoLiberiaLithuaniaLow & middle incomeLow incomeLower middle incomeLuxembourgMacao SAR, ChinaMacedonia, FYRMadagascarMalawiMalaysiaMaldivesMaliMaltaMauritiusMexicoMicronesia, Fed. Sts.Middle East & North AfricaMiddle East & North Africa (excluding high income)Middle East & North Africa (IDA & IBRD countries)Middle incomeMoldovaMongoliaMoroccoMozambiqueNamibiaNepalNetherlandsNew ZealandNicaraguaNorth AmericaNorwayOECD membersOmanOther small statesPakistanPanamaPapua New GuineaParaguayPeruPhilippinesPolandPortugalPost-demographic dividendPre-demographic dividendRomaniaRussian FederationRwandaSamoaSan MarinoSao Tome and PrincipeSenegalSerbiaSeychellesSierra LeoneSingaporeSlovak RepublicSloveniaSmall statesSolomon IslandsSouth AfricaSouth AsiaSouth Asia (IDA & IBRD)SpainSri LankaSt. Kitts and NevisSt. LuciaSub-Saharan Africa Sub-Saharan Africa (excluding high income)Sub-Saharan Africa (IDA & IBRD countries)SurinameSwazilandSwedenSwitzerlandSyrian Arab RepublicTajikistanTanzaniaThailandTimor-LesteTogoTrinidad and TobagoTunisiaTurkeyUgandaUkraineUnited KingdomUnited StatesUpper middle incomeUruguayVanuatuVenezuela, RBVietnamWest Bank and GazaWorldYemen, Rep.ZambiaZimbabwe

Timeline:

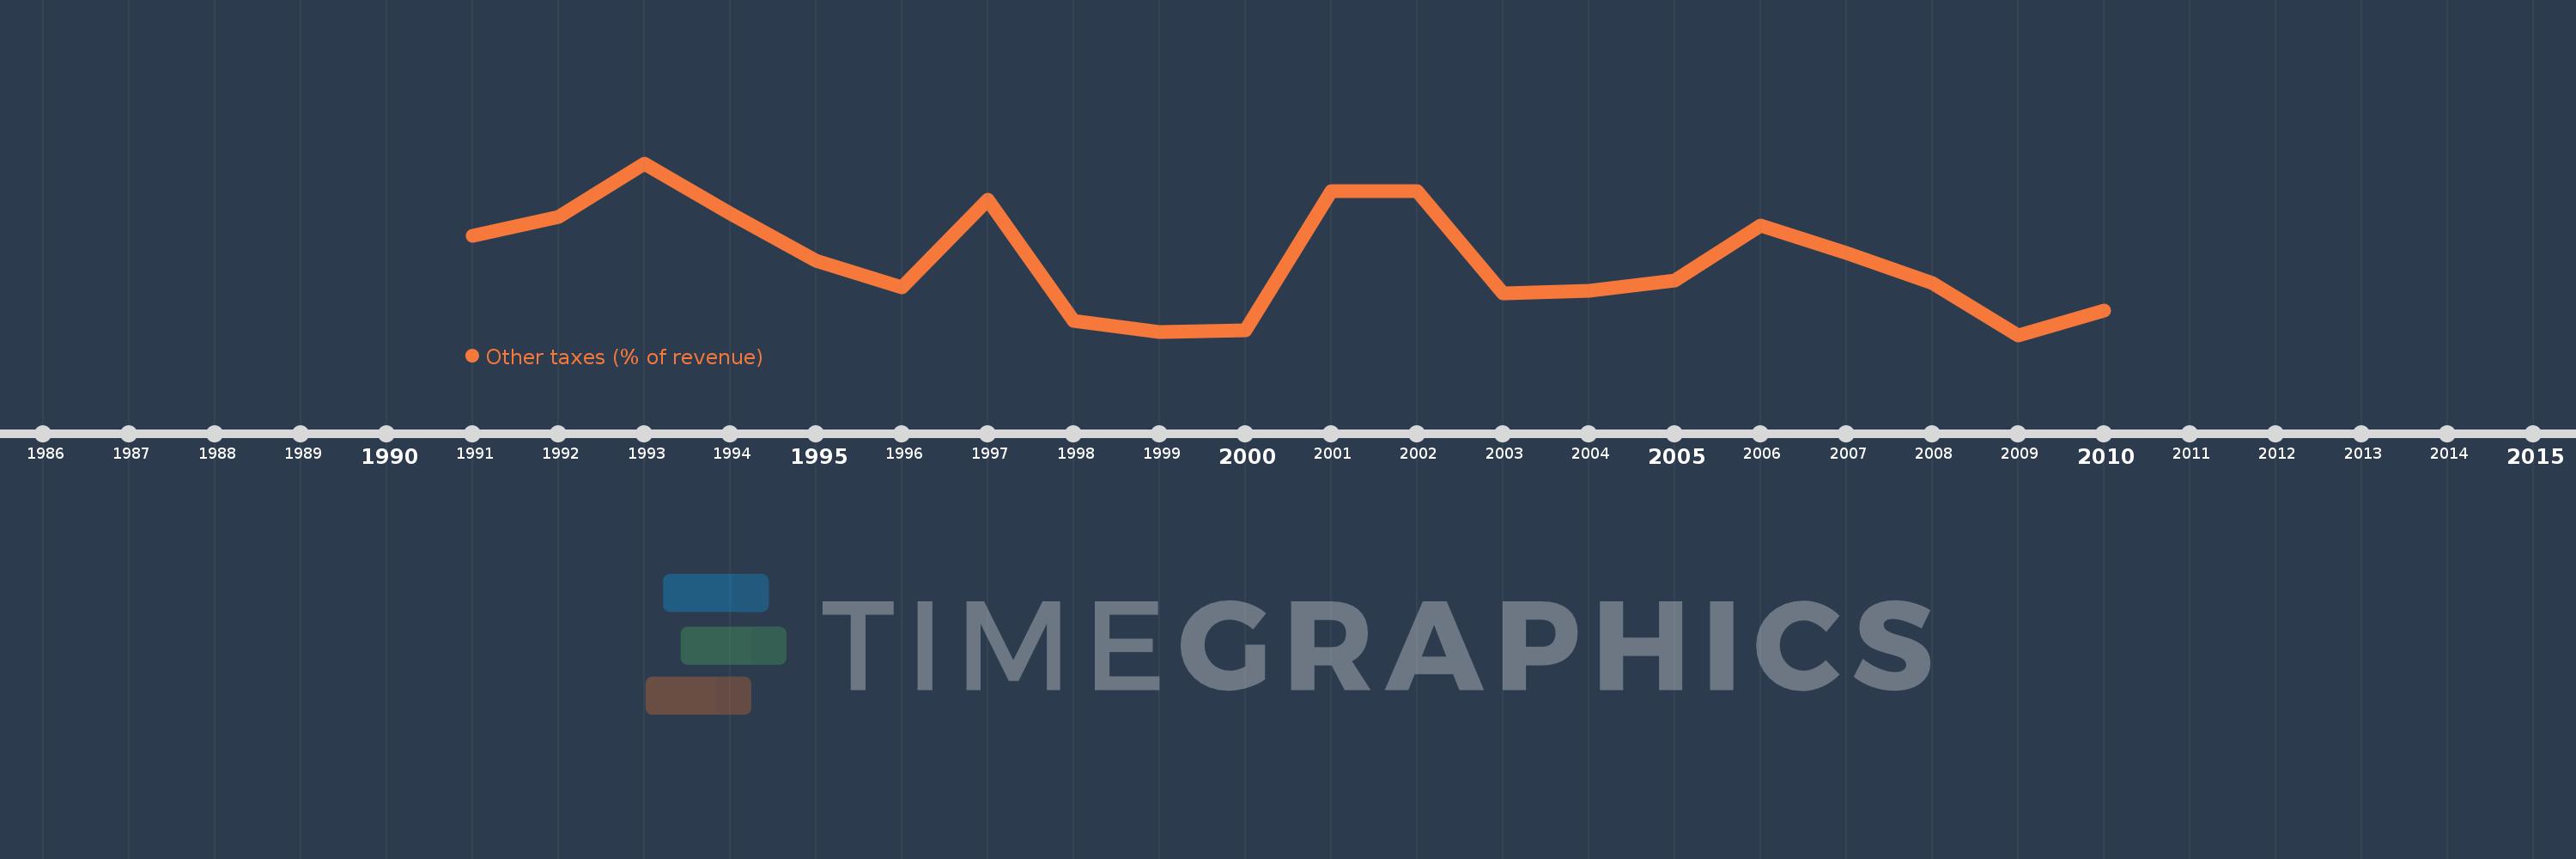
This timeline shows a graph from 1991 to 2010 of Middle East & North Africa (IDA & IBRD countries). No data until 1990. Number of actual observations by date: 20.

Source name:

World Development Indicators

Source organization:

International Monetary Fund, Government Finance Statistics Yearbook and data files.

Categories, topics:

Public Sector

Last updated:

apr 23, 2017

Indicators value changes by year

Meaning:
3.151
Minimum:
2.109
jan 1, 2009
Maximum:
4.518
jan 1, 1993
At the date of observation
Value
Absolute change
Change from the previous value
jan 1, 1991
3.501
+3.501
0.0%
jan 1, 1992
3.76
+0.259
7.41%
jan 1, 1993
4.518
+0.758
20.16%
jan 1, 1994
3.81
-0.708
-15.67%
jan 1, 1995
3.152
-0.658
-17.26%
jan 1, 1996
2.775
-0.377
-11.96%
jan 1, 1997
4.009
+1.234
44.44%
jan 1, 1998
2.308
-1.701
-42.44%
jan 1, 1999
2.149
-0.159
-6.89%
jan 1, 2000
2.175
+0.027
1.24%
jan 1, 2001
4.129
+1.953
89.81%
jan 1, 2002
4.129
0.0
0.0%
jan 1, 2003
2.694
-1.434
-34.74%
jan 1, 2004
2.727
+0.033
1.22%
jan 1, 2005
2.879
+0.152
5.57%
jan 1, 2006
3.649
+0.77
26.74%
jan 1, 2007
3.255
-0.393
-10.78%
jan 1, 2008
2.838
-0.417
-12.82%
jan 1, 2009
2.109
-0.729
-25.7%
jan 1, 2010
2.452
+0.343
16.28%

Ranking of countries by current statistics by years