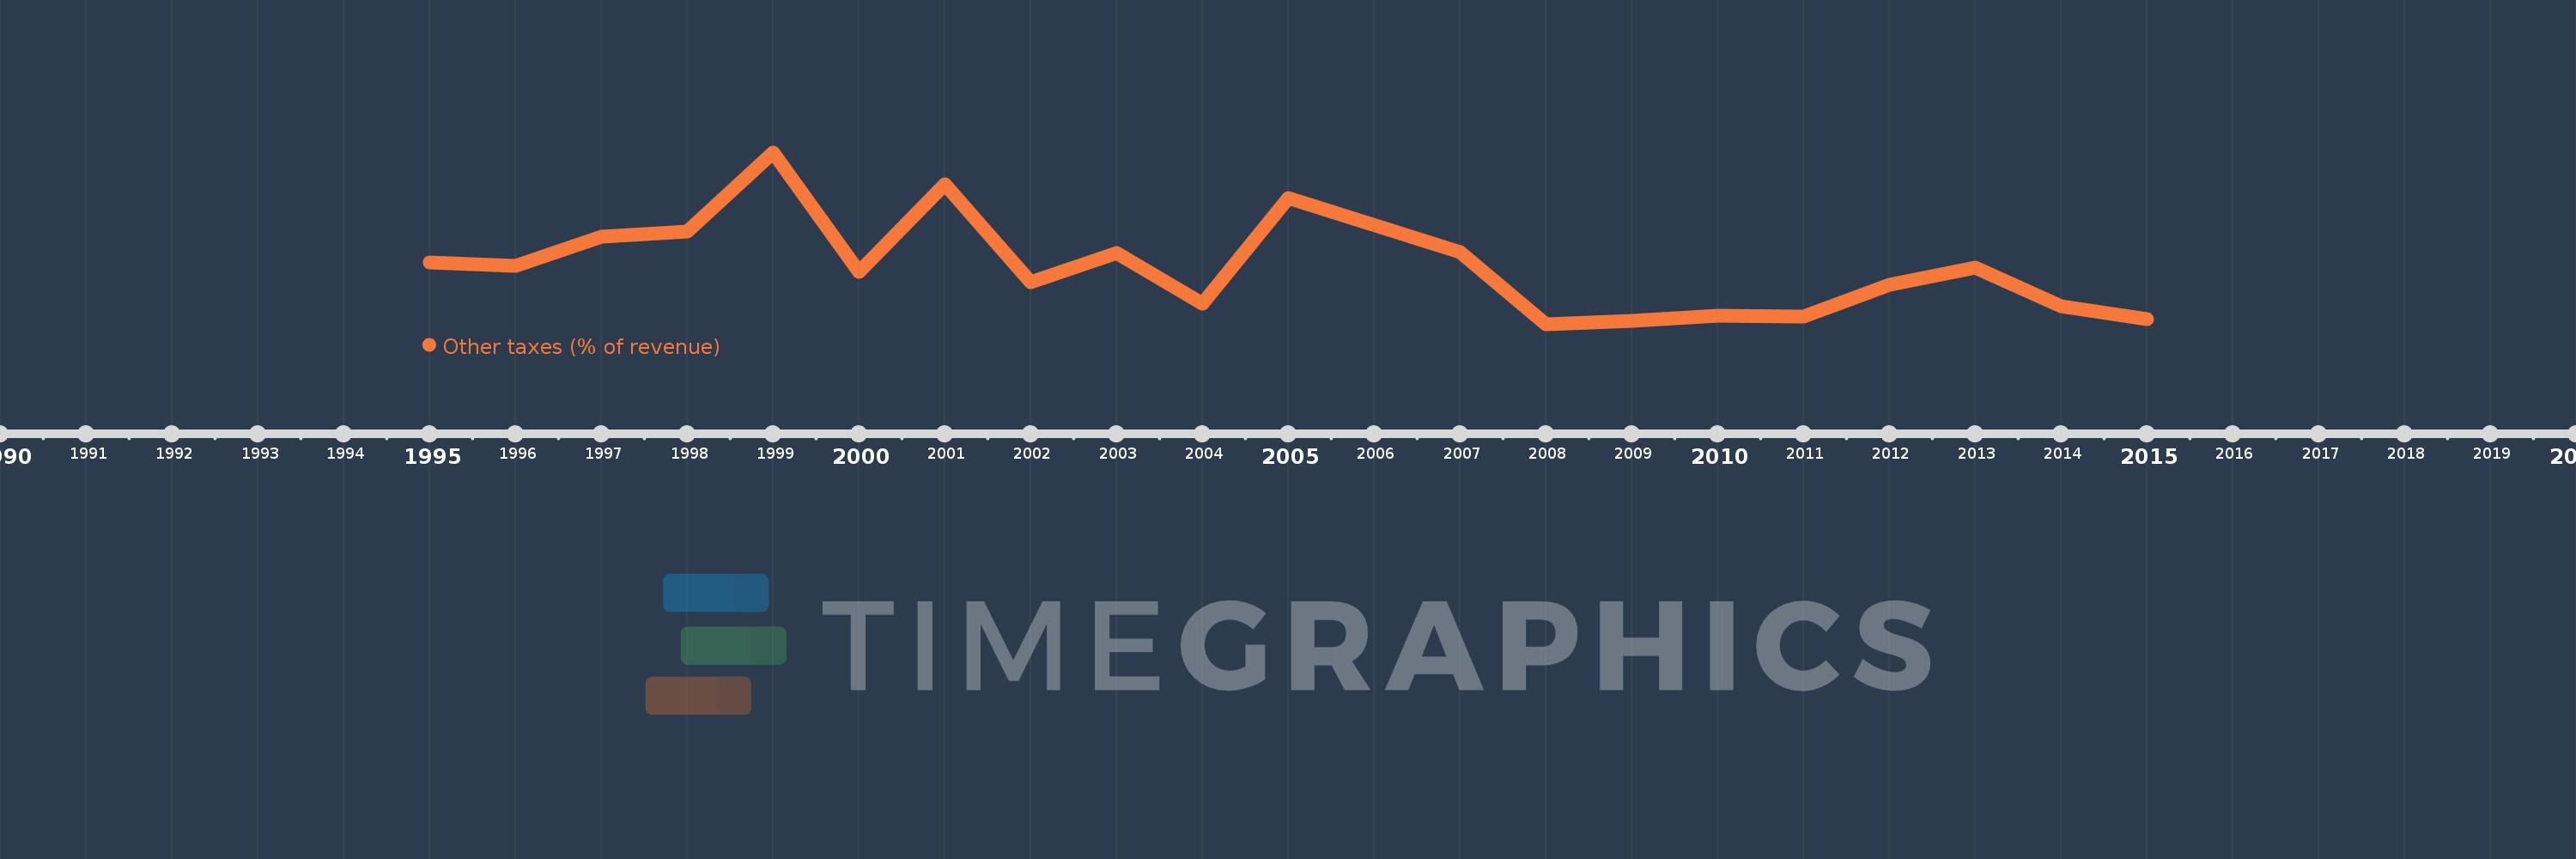
This timeline shows a graph from 1995 to 2015 of East Asia & Pacific (excluding high income). No data until 1994. Number of actual observations by date: 20.
Source name:
World Development Indicators
Source organization:
International Monetary Fund, Government Finance Statistics Yearbook and data files.
Categories, topics:
Public Sector
Last updated:
apr 23, 2017
Indicators value changes by year
Meaning:
1.258
Minimum:
0.497
jan 1, 2008
Maximum:
2.804
jan 1, 1999
At the date of observation
Value
Absolute change
Change from the previous value
jan 1, 1995
1.329
+1.329
0.0%
jan 1, 1996
1.278
-0.051
-3.86%
jan 1, 1997
1.669
+0.392
30.65%
jan 1, 1998
1.736
+0.066
3.97%
jan 1, 1999
2.804
+1.068
61.56%
jan 1, 2000
1.195
-1.609
-57.37%
jan 1, 2001
2.374
+1.178
98.57%
jan 1, 2002
1.061
-1.313
-55.32%
jan 1, 2003
1.455
+0.395
37.2%
jan 1, 2004
0.769
-0.686
-47.17%
jan 1, 2005
2.191
+1.422
185.04%
jan 1, 2007
1.468
-0.723
-33.01%
jan 1, 2008
0.497
-0.971
-66.16%
jan 1, 2009
0.547
+0.05
10.07%
jan 1, 2010
0.611
+0.064
11.65%
jan 1, 2011
0.6
-0.011
-1.74%
jan 1, 2012
1.021
+0.421
70.16%
jan 1, 2013
1.261
+0.24
23.5%
jan 1, 2014
0.734
-0.527
-41.79%
jan 1, 2015
0.565
-0.169
-23.0%
Ranking of countries by current statistics by years