33
/
AIzaSyAYiBZKx7MnpbEhh9jyipgxe19OcubqV5w
August 1, 2025
50031
Middle East & North Africa (IDA & IBRD countries)
TMN
false
2
1
GNI (current US$)
2015,2014,2013,2012,2011,2010,2009,2008,2007,2006,2005,2004,2003,2002,2001,2000,1999,1998,1997,1996,1995,1994
Download
Global statistics library →Middle East & North Africa (IDA & IBRD countries) →

GNI (current US$)

This statistics in other country:

AfghanistanAlbaniaAlgeriaAmerican SamoaAndorraAngolaAntigua and BarbudaArab WorldArgentinaArmeniaAustraliaAustriaAzerbaijanBahamas, TheBahrainBangladeshBarbadosBelarusBelgiumBelizeBeninBermudaBhutanBoliviaBosnia and HerzegovinaBotswanaBrazilBrunei DarussalamBulgariaBurkina FasoBurundiCabo VerdeCambodiaCameroonCanadaCaribbean small statesCentral African RepublicCentral Europe and the BalticsChadChannel IslandsChileChinaColombiaComorosCongo, Dem. Rep.Congo, Rep.Costa RicaCote d'IvoireCroatiaCubaCyprusCzech RepublicDenmarkDjiboutiDominicaDominican RepublicEarly-demographic dividendEast Asia & PacificEast Asia & Pacific (excluding high income)East Asia & Pacific (IDA & IBRD countries)EcuadorEgypt, Arab Rep.El SalvadorEquatorial GuineaEritreaEstoniaEthiopiaEuro areaEurope & Central AsiaEurope & Central Asia (excluding high income)Europe & Central Asia (IDA & IBRD countries)European UnionFaroe IslandsFijiFinlandFragile and conflict affected situationsFranceFrench PolynesiaGabonGambia, TheGeorgiaGermanyGhanaGreeceGreenlandGrenadaGuatemalaGuineaGuinea-BissauGuyanaHaitiHeavily indebted poor countries (HIPC)High incomeHondurasHong Kong SAR, ChinaHungaryIBRD onlyIcelandIDA & IBRD totalIDA blendIDA onlyIDA totalIndiaIndonesiaIran, Islamic Rep.IraqIrelandIsle of ManIsraelItalyJamaicaJapanJordanKazakhstanKenyaKiribatiKorea, Rep.KosovoKuwaitKyrgyz RepublicLao PDRLate-demographic dividendLatin America & Caribbean Latin America & Caribbean (excluding high income)Latin America & the Caribbean (IDA & IBRD countries)LatviaLeast developed countries: UN classificationLebanonLesothoLiberiaLibyaLiechtensteinLithuaniaLow & middle incomeLow incomeLower middle incomeLuxembourgMacao SAR, ChinaMacedonia, FYRMadagascarMalawiMalaysiaMaldivesMaliMaltaMarshall IslandsMauritaniaMauritiusMexicoMicronesia, Fed. Sts.Middle East & North AfricaMiddle East & North Africa (excluding high income)Middle East & North Africa (IDA & IBRD countries)Middle incomeMoldovaMonacoMongoliaMontenegroMoroccoMozambiqueMyanmarNamibiaNauruNepalNetherlandsNew CaledoniaNew ZealandNicaraguaNigerNigeriaNorth AmericaNorwayOECD membersOmanOther small statesPacific island small statesPakistanPalauPanamaPapua New GuineaParaguayPeruPhilippinesPolandPortugalPost-demographic dividendPre-demographic dividendPuerto RicoQatarRomaniaRussian FederationRwandaSamoaSan MarinoSao Tome and PrincipeSaudi ArabiaSenegalSerbiaSeychellesSierra LeoneSingaporeSlovak RepublicSloveniaSmall statesSolomon IslandsSomaliaSouth AfricaSouth AsiaSouth Asia (IDA & IBRD)South SudanSpainSri LankaSt. Kitts and NevisSt. LuciaSt. Vincent and the GrenadinesSub-Saharan Africa Sub-Saharan Africa (excluding high income)Sub-Saharan Africa (IDA & IBRD countries)SudanSurinameSwazilandSwedenSwitzerlandSyrian Arab RepublicTajikistanTanzaniaThailandTimor-LesteTogoTongaTrinidad and TobagoTunisiaTurkeyTurkmenistanTuvaluUgandaUkraineUnited Arab EmiratesUnited KingdomUnited StatesUpper middle incomeUruguayUzbekistanVanuatuVenezuela, RBVietnamVirgin Islands (U.S.)West Bank and GazaWorldYemen, Rep.ZambiaZimbabwe

Timeline:

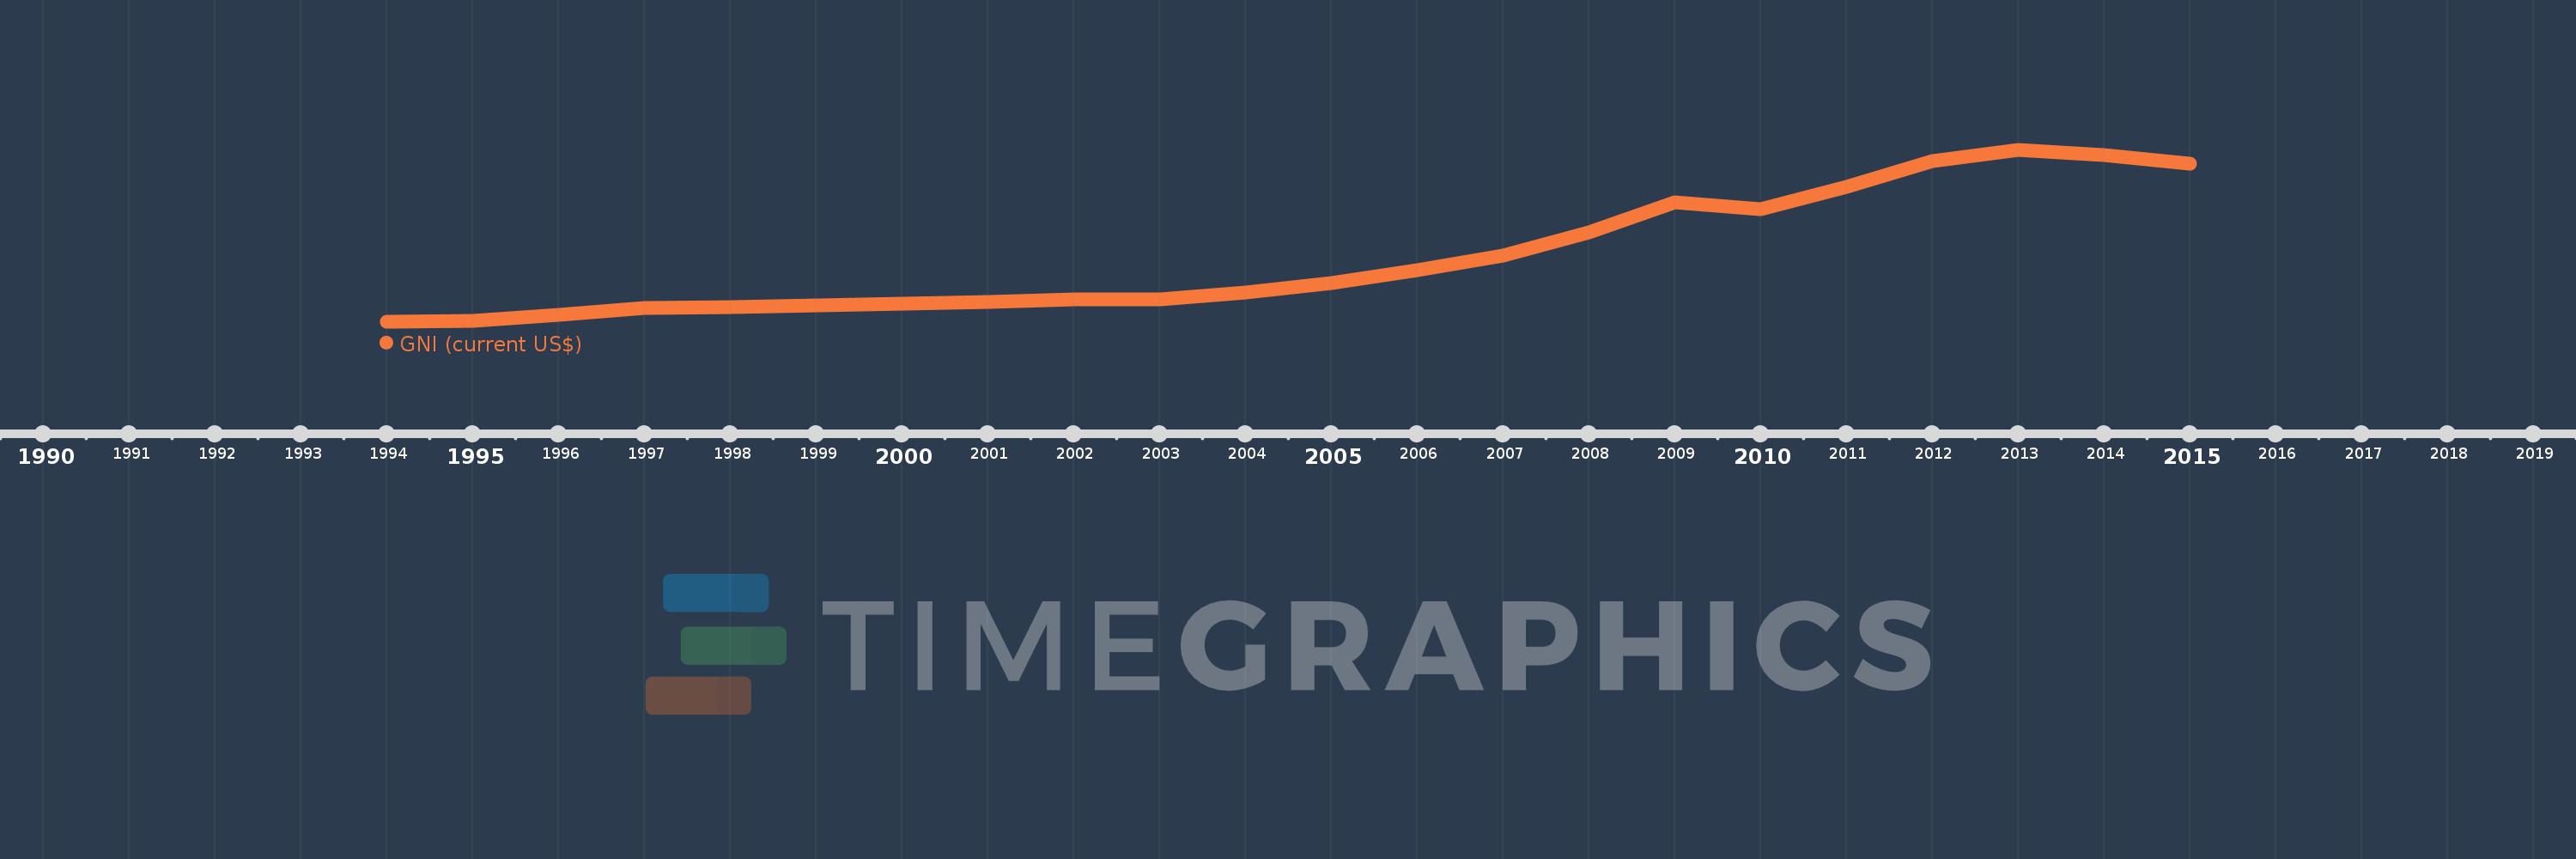
This timeline shows a graph from 1994 to 2015 of Middle East & North Africa (IDA & IBRD countries). No data until 1993. Number of actual observations by date: 22.

Source name:

World Development Indicators

Source organization:

World Bank national accounts data, and OECD National Accounts data files.

Categories, topics:

Economy & Growth, External Debt

Last updated:

apr 23, 2017

Indicators value changes by year

Meaning:
788.256 bln
Minimum:
264.787 bln
jan 1, 1994
Maximum:
1.641 trl
jan 1, 2013
At the date of observation
Value
Absolute change
Change from the previous value
jan 1, 1994
264.787 bln
+264.787 bln
0.0%
jan 1, 1995
275.178 bln
+10.392 bln
3.92%
jan 1, 1996
323.9 bln
+48.721 bln
17.71%
jan 1, 1997
374.713 bln
+50.814 bln
15.69%
jan 1, 1998
384.243 bln
+9.53 bln
2.54%
jan 1, 1999
396.64 bln
+12.397 bln
3.23%
jan 1, 2000
408.682 bln
+12.043 bln
3.04%
jan 1, 2001
423.034 bln
+14.351 bln
3.51%
jan 1, 2002
446.115 bln
+23.081 bln
5.46%
jan 1, 2003
444.896 bln
-1.219 bln
-0.27%
jan 1, 2004
499.452 bln
+54.556 bln
12.26%
jan 1, 2005
573.505 bln
+74.053 bln
14.83%
jan 1, 2006
677.867 bln
+104.361 bln
18.2%
jan 1, 2007
793.362 bln
+115.495 bln
17.04%
jan 1, 2008
984.746 bln
+191.385 bln
24.12%
jan 1, 2009
1.225 trl
+240.134 bln
24.39%
jan 1, 2010
1.171 trl
-54.296 bln
-4.43%
jan 1, 2011
1.345 trl
+174.184 bln
14.88%
jan 1, 2012
1.552 trl
+206.766 bln
15.38%
jan 1, 2013
1.641 trl
+89.396 bln
5.76%
jan 1, 2014
1.604 trl
-36.767 bln
-2.24%
jan 1, 2015
1.534 trl
-70.515 bln
-4.4%

Ranking of countries by current statistics by years