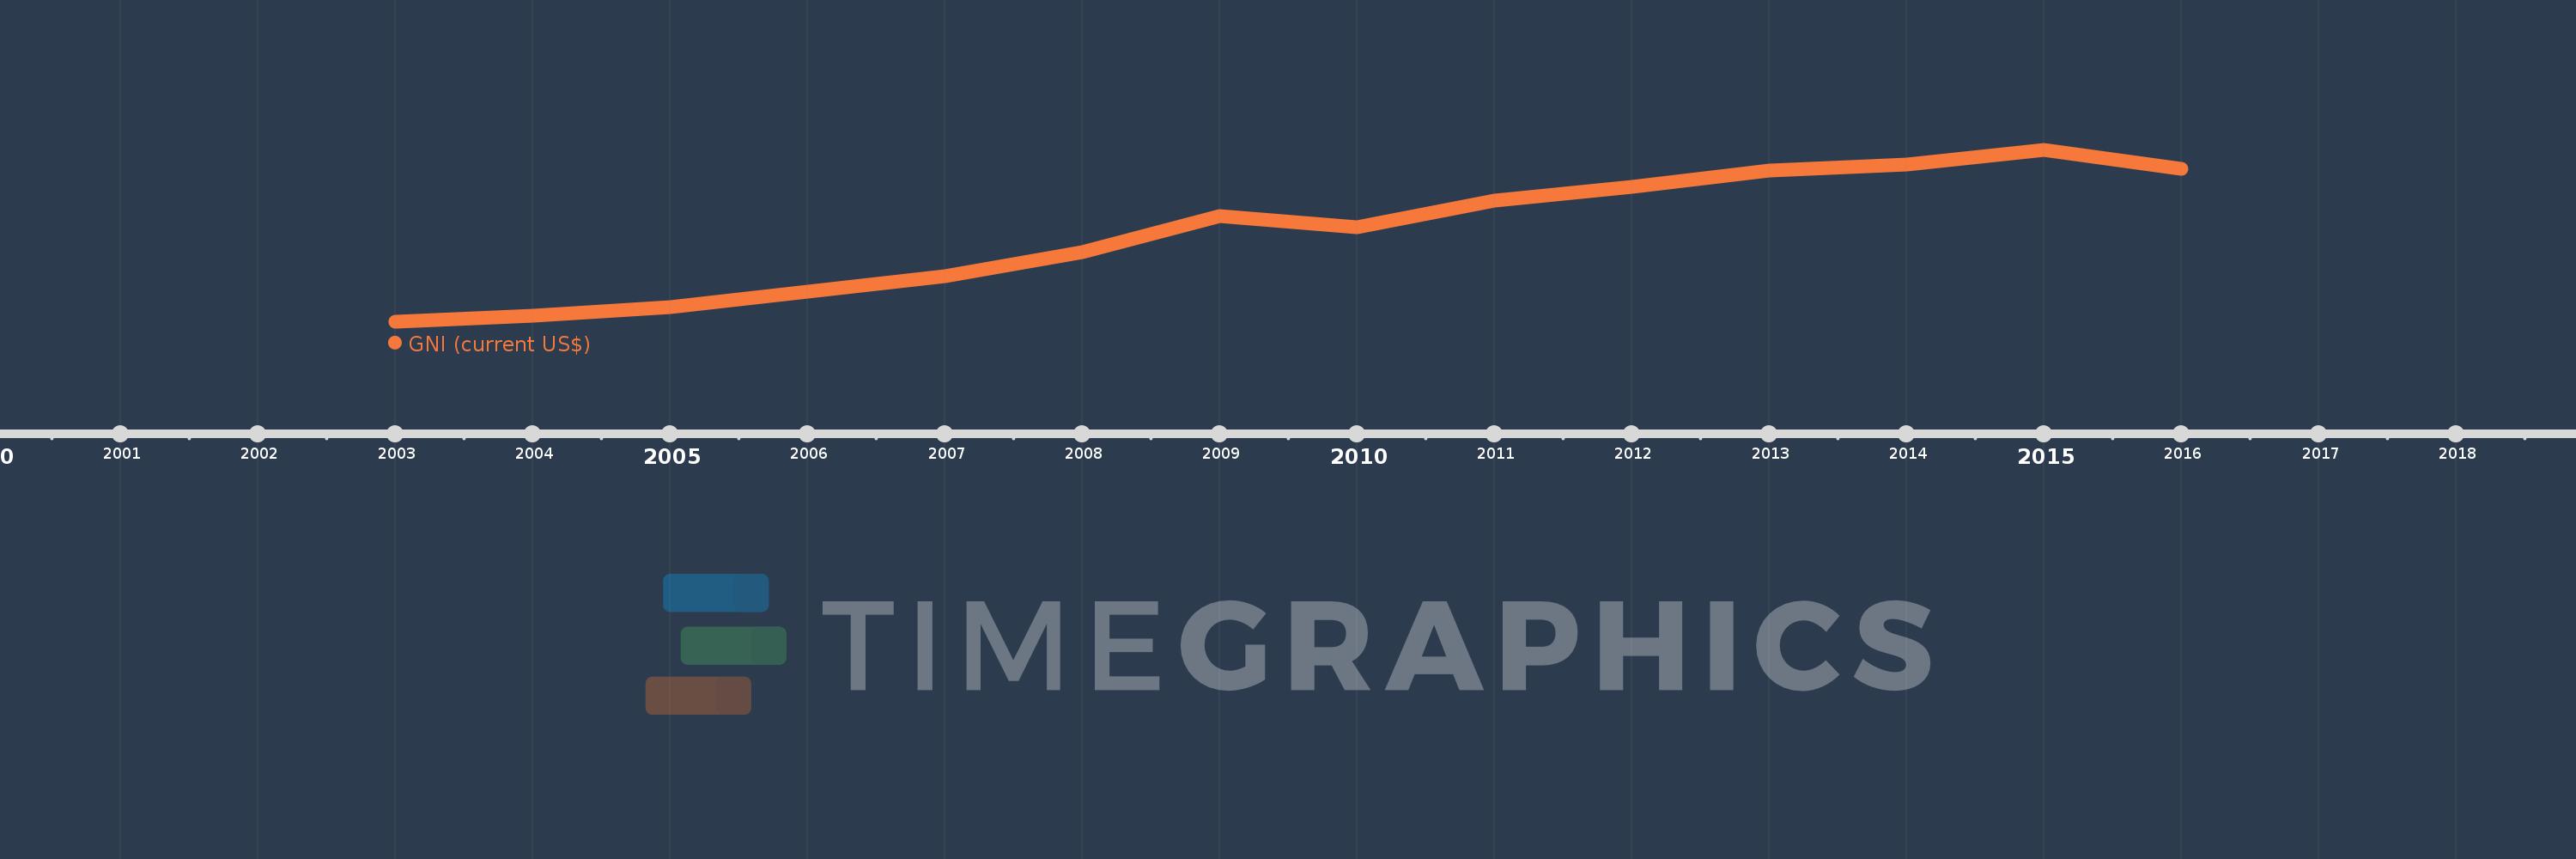
This timeline shows a graph from 2003 to 2016 of Fragile and conflict affected situations. No data until 2002. Number of actual observations by date: 14.
Source name:
World Development Indicators
Source organization:
World Bank national accounts data, and OECD National Accounts data files.
Categories, topics:
Economy & Growth, External Debt
Last updated:
apr 23, 2017
Indicators value changes by year
Meaning:
497.831 bln
Minimum:
182.627 bln
jan 1, 2003
Maximum:
784.564 bln
jan 1, 2015
At the date of observation
Value
Absolute change
Change from the previous value
jan 1, 2003
182.627 bln
+182.627 bln
0.0%
jan 1, 2004
203.95 bln
+21.323 bln
11.68%
jan 1, 2005
235.651 bln
+31.701 bln
15.54%
jan 1, 2006
289.904 bln
+54.254 bln
23.02%
jan 1, 2007
342.746 bln
+52.842 bln
18.23%
jan 1, 2008
426.57 bln
+83.824 bln
24.46%
jan 1, 2009
554.604 bln
+128.034 bln
30.01%
jan 1, 2010
515.017 bln
-39.587 bln
-7.14%
jan 1, 2011
607.64 bln
+92.623 bln
17.98%
jan 1, 2012
657.476 bln
+49.835 bln
8.2%
jan 1, 2013
714.365 bln
+56.89 bln
8.65%
jan 1, 2014
734.631 bln
+20.266 bln
2.84%
jan 1, 2015
784.564 bln
+49.933 bln
6.8%
jan 1, 2016
719.886 bln
-64.678 bln
-8.24%
Ranking of countries by current statistics by years