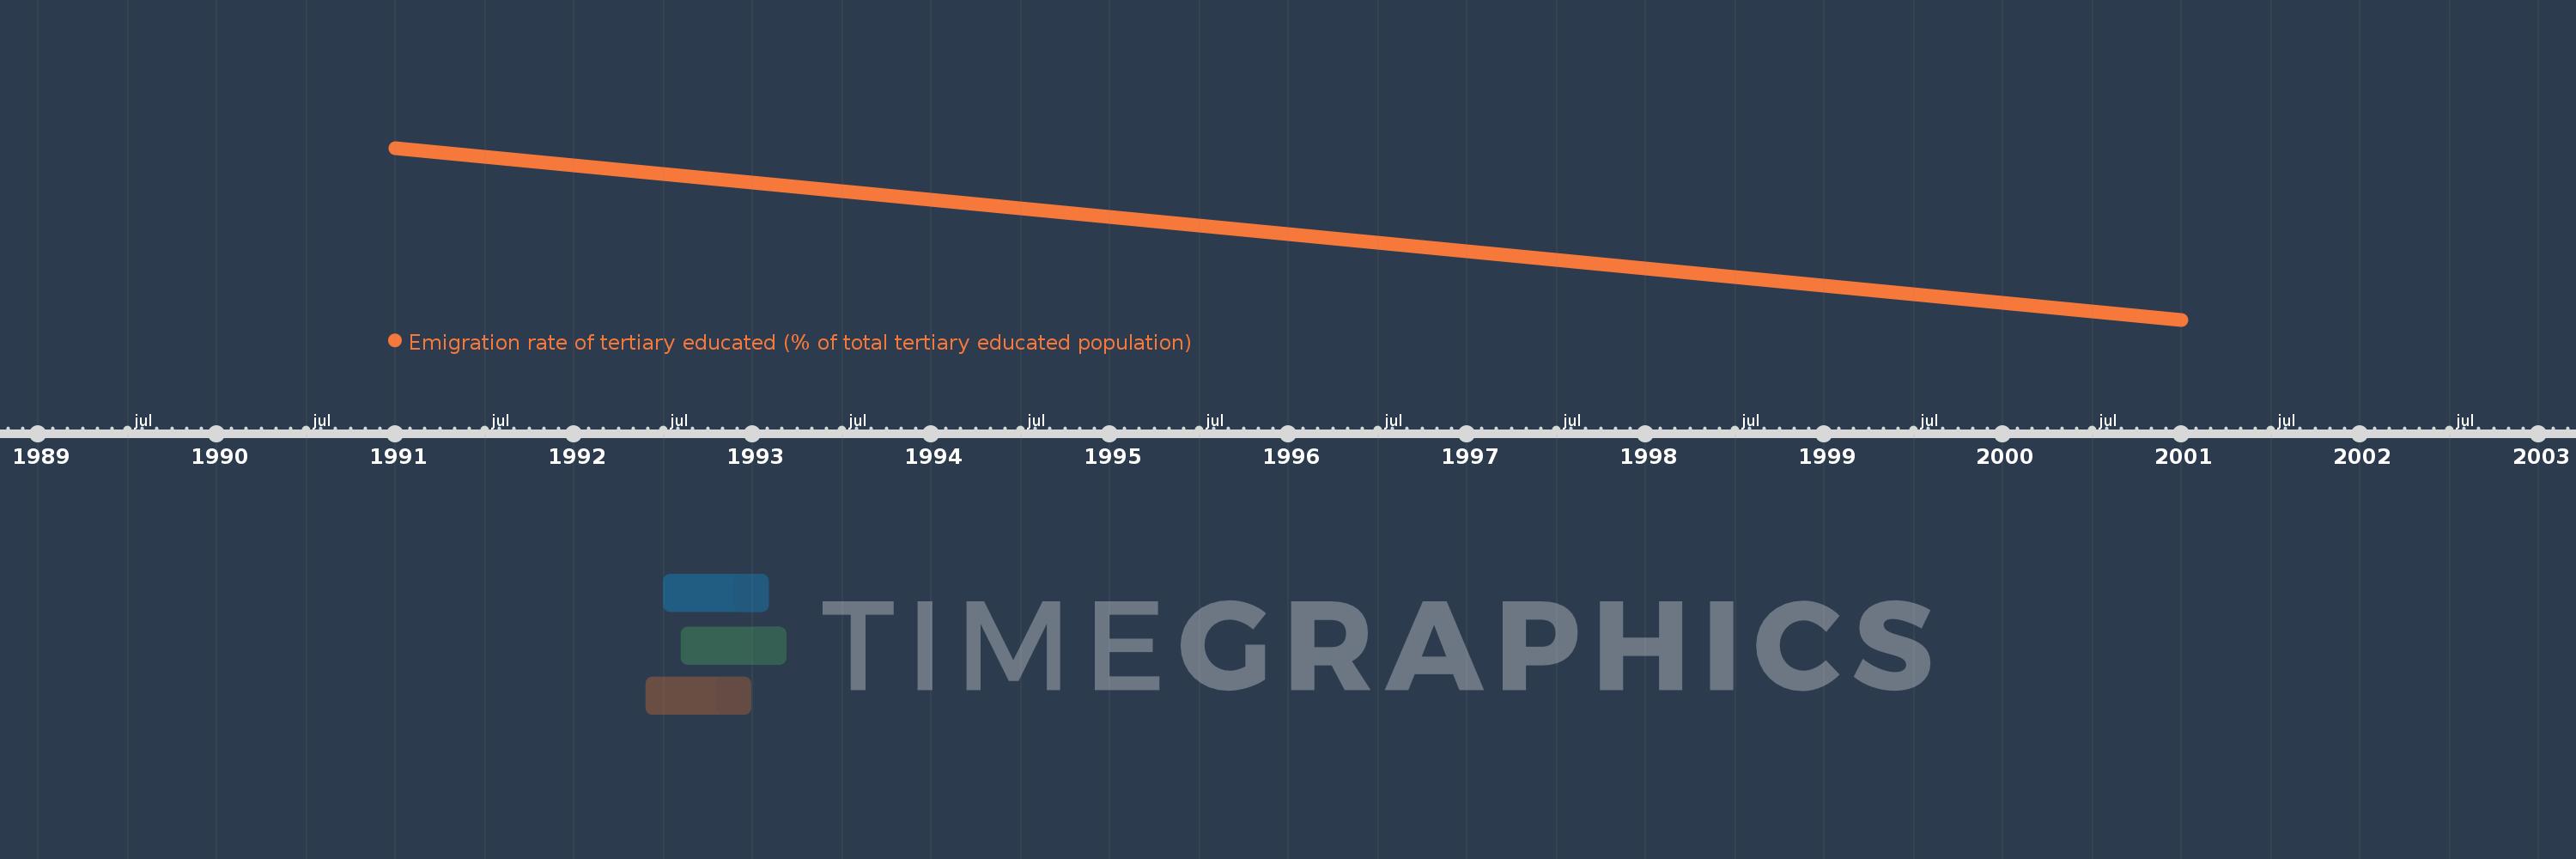
This timeline shows a graph from 1991 to 2001 of Middle East & North Africa (IDA & IBRD countries). No data until 1990. Number of actual observations by date: 2.
Source name:
World Development Indicators
Source organization:
Frédéric Docquier, B. Lindsay Lowell, and Abdeslam Marfouk's , "A Gendered Assessment of Highly Skilled Emigration" (2009).
Categories, topics:
Education, Financial Sector, Health
Last updated:
apr 23, 2017
Indicators value changes by year
Meaning:
11.931
Minimum:
10.442
jan 1, 2001
Maximum:
13.42
jan 1, 1991
At the date of observation
Value
Absolute change
Change from the previous value
jan 1, 1991
13.42
+13.42
0.0%
jan 1, 2001
10.442
-2.978
-22.19%
Ranking of countries by current statistics by years