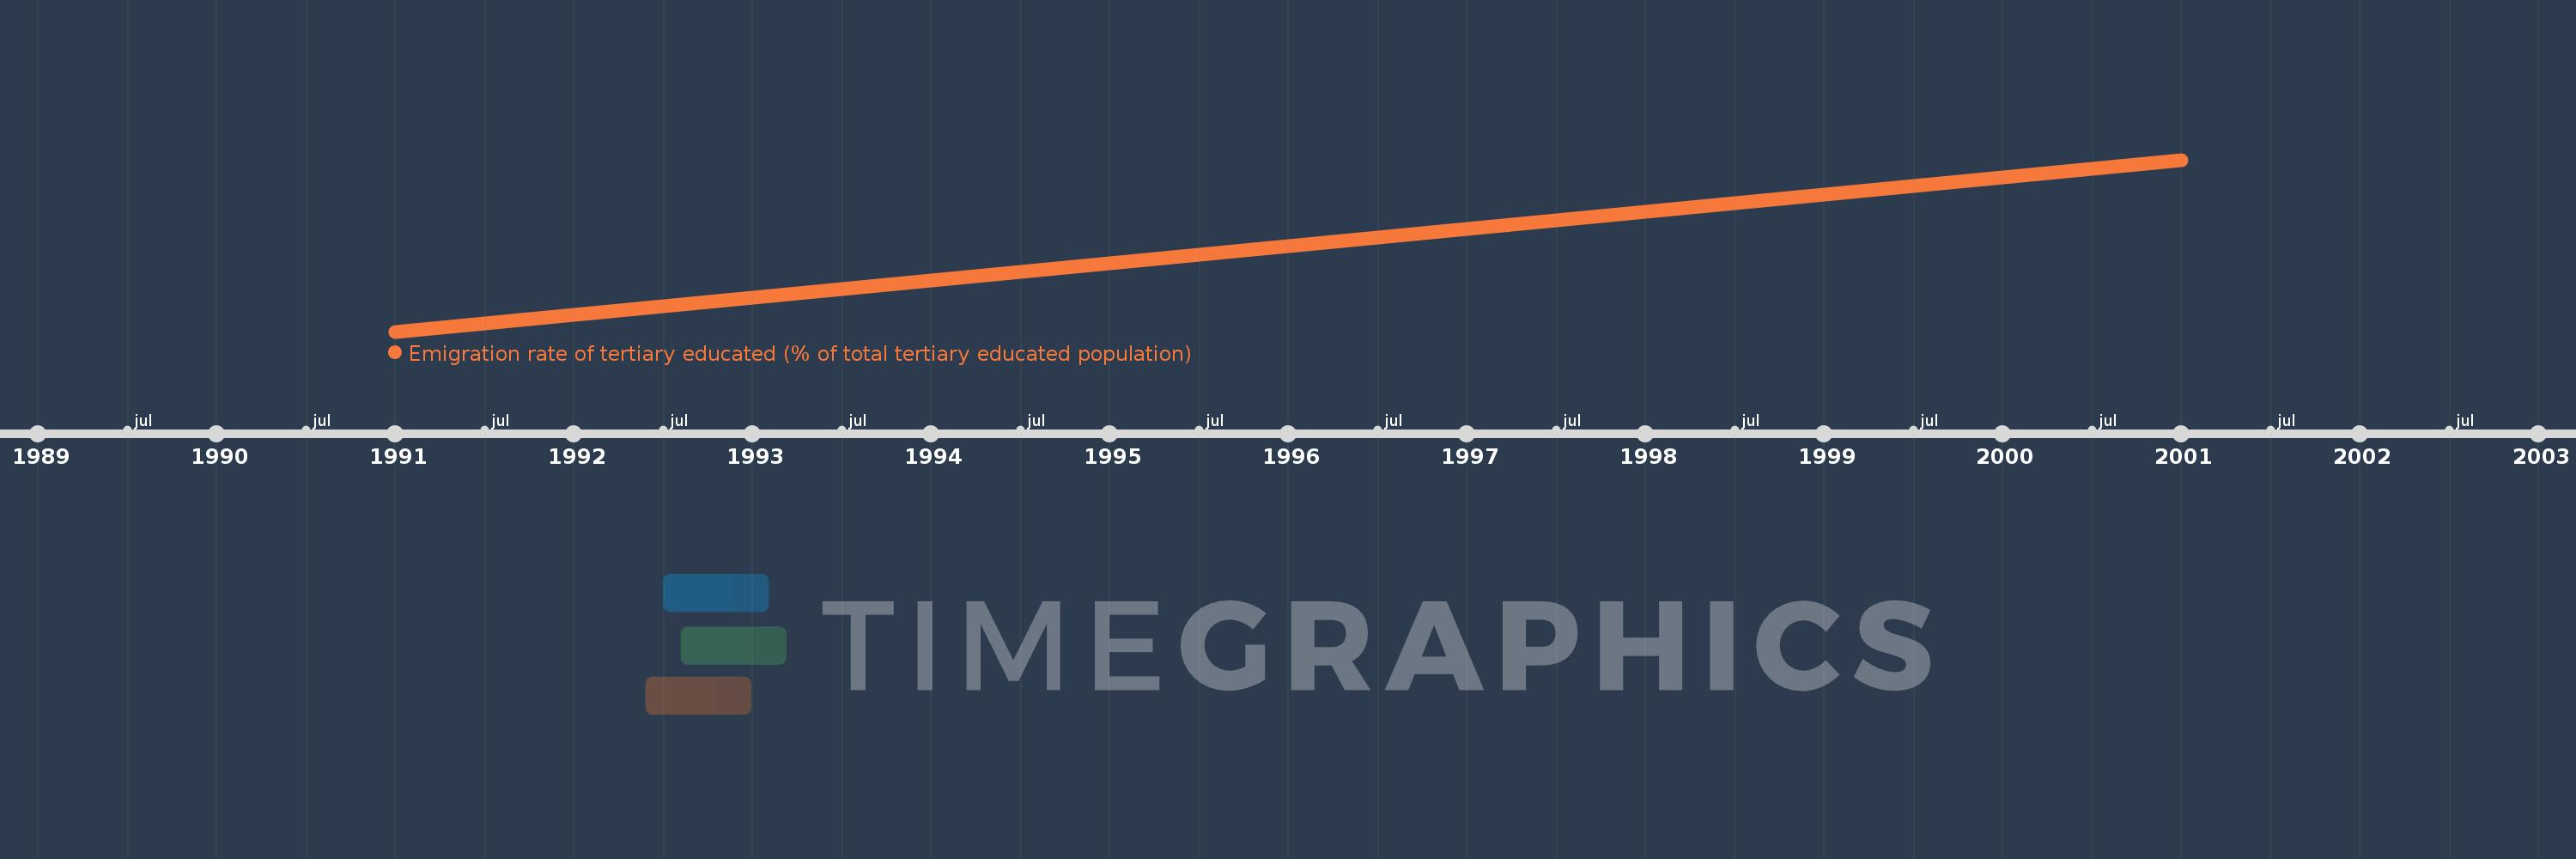
This timeline shows a graph from 1991 to 2001 of East Asia & Pacific (excluding high income). No data until 1990. Number of actual observations by date: 2.
Source name:
World Development Indicators
Source organization:
Frédéric Docquier, B. Lindsay Lowell, and Abdeslam Marfouk's , "A Gendered Assessment of Highly Skilled Emigration" (2009).
Categories, topics:
Education, Financial Sector, Health
Last updated:
apr 23, 2017
Indicators value changes by year
Meaning:
6.942
Minimum:
6.872
jan 1, 1991
Maximum:
7.011
jan 1, 2001
At the date of observation
Value
Absolute change
Change from the previous value
jan 1, 1991
6.872
+6.872
0.0%
jan 1, 2001
7.011
+0.139
2.02%
Ranking of countries by current statistics by years