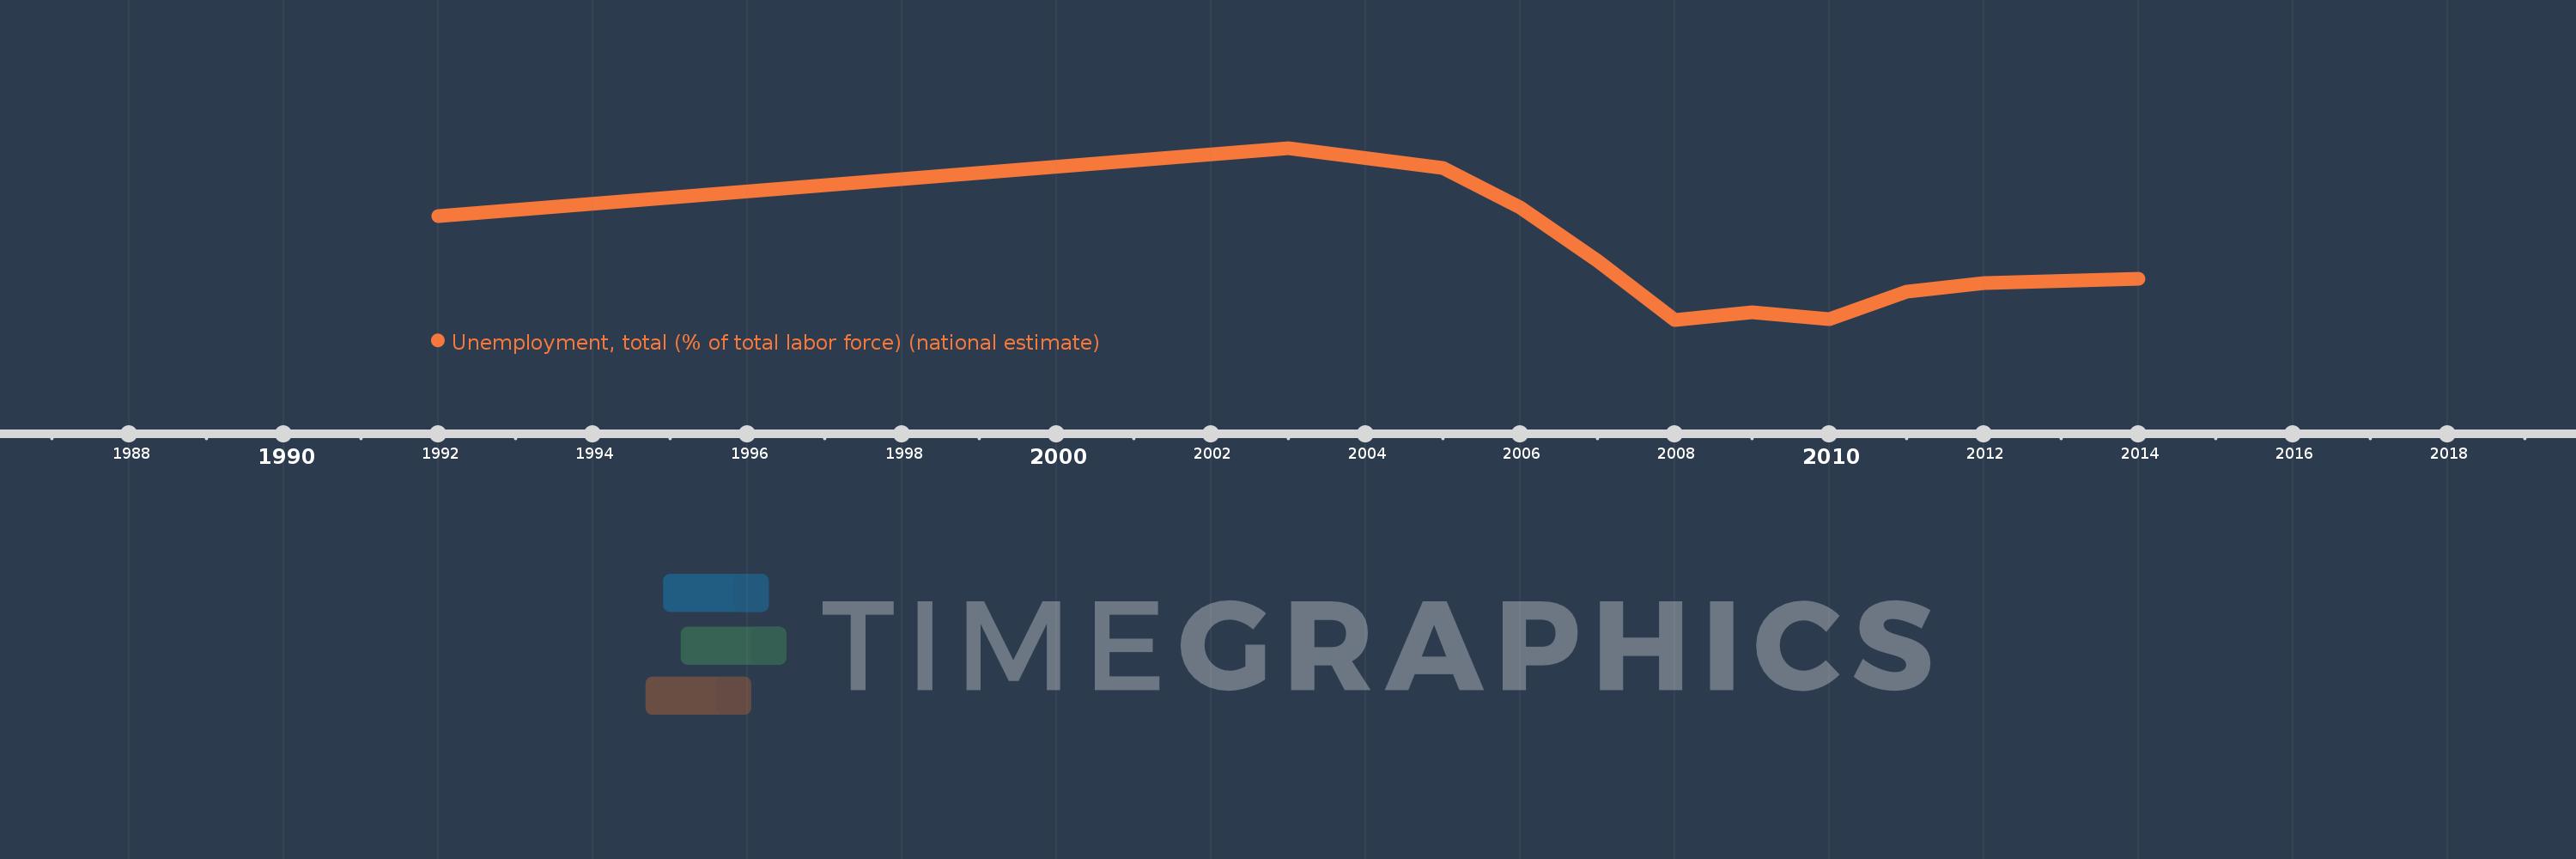
This timeline shows a graph from 1992 to 2014 of Middle East & North Africa (excluding high income). No data until 1991. Number of actual observations by date: 11.
Source name:
World Development Indicators
Source organization:
International Labour Organization, Key Indicators of the Labour Market database.
Categories, topics:
Social Protection & Labor
Last updated:
apr 23, 2017
Indicators value changes by year
Meaning:
11.974
Minimum:
10.756
jan 1, 2008
Maximum:
13.991
jan 1, 2003
At the date of observation
Value
Absolute change
Change from the previous value
jan 1, 1992
12.703
+12.703
0.0%
jan 1, 2003
13.991
+1.288
10.14%
jan 1, 2005
13.607
-0.384
-2.74%
jan 1, 2006
12.868
-0.74
-5.44%
jan 1, 2007
11.874
-0.994
-7.72%
jan 1, 2008
10.756
-1.118
-9.42%
jan 1, 2009
10.903
+0.148
1.37%
jan 1, 2010
10.769
-0.134
-1.23%
jan 1, 2011
11.277
+0.508
4.72%
jan 1, 2012
11.439
+0.163
1.44%
jan 1, 2014
11.532
+0.093
0.81%
Ranking of countries by current statistics by years