33
/
AIzaSyB4mHJ5NPEv-XzF7P6NDYXjlkCWaeKw5bc
November 30, 2025
43123
Latin America & Caribbean (excluding high income)
LAC
false
2
1
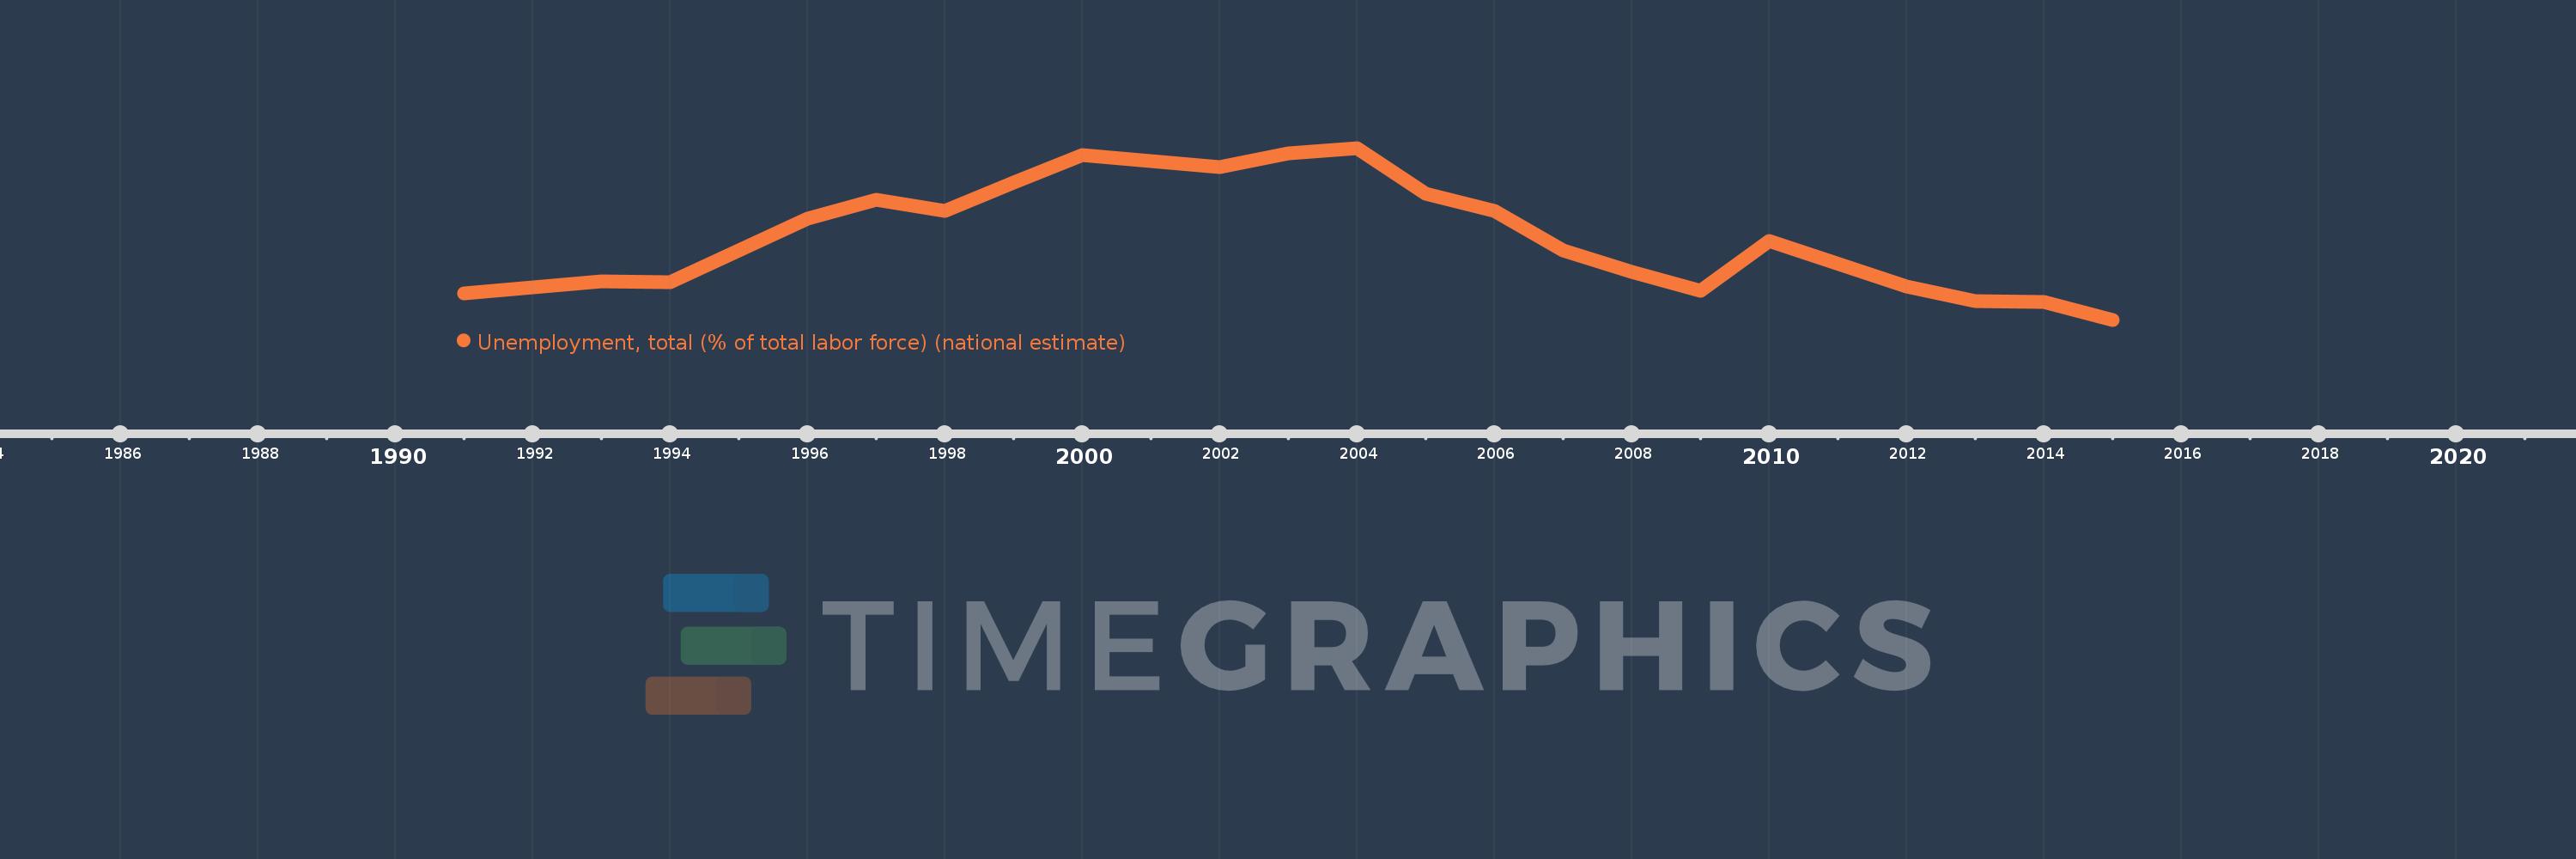
Unemployment, total (% of total labor force) (national estimate)
2015,2014,2013,2012,2010,2009,2008,2007,2006,2005,2004,2003,2002,2000,1999,1998,1997,1996,1994,1993,1991