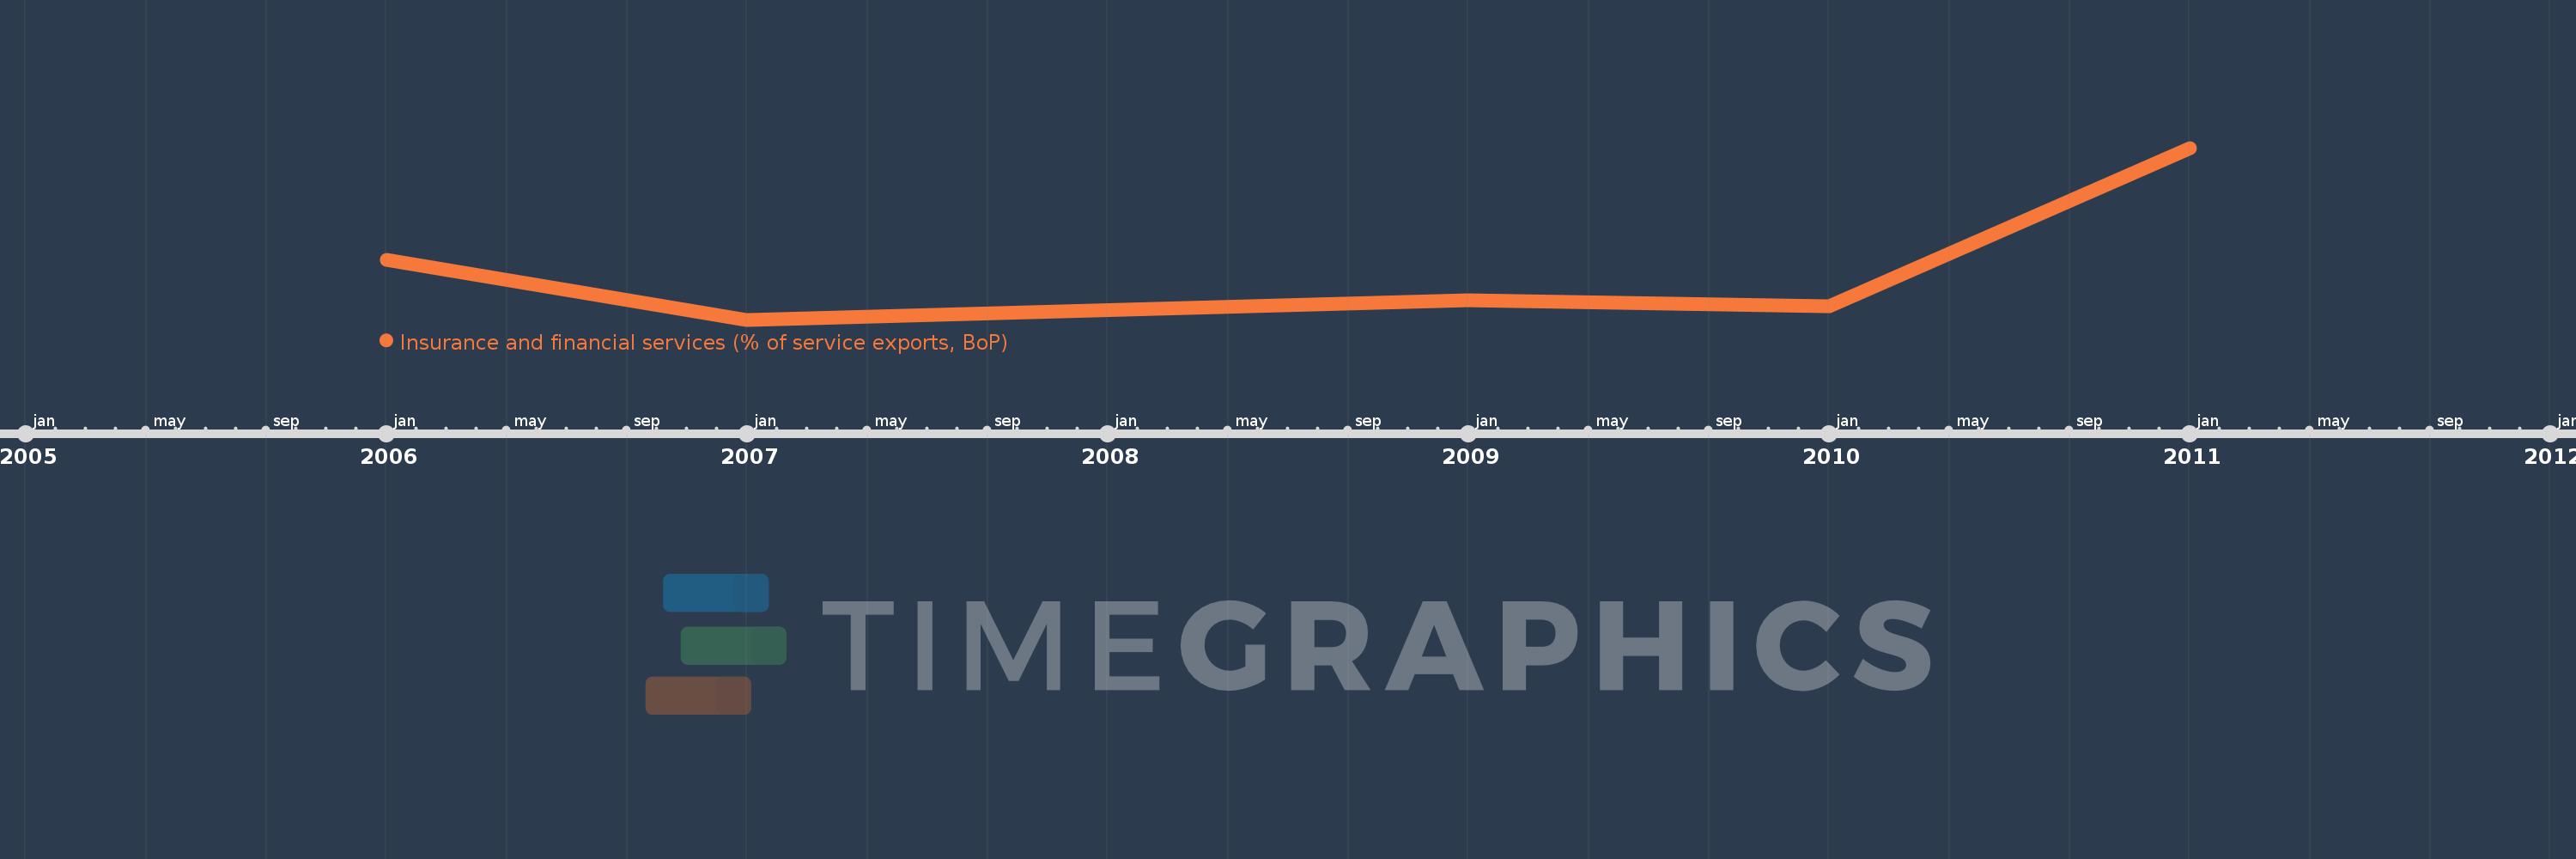
This timeline shows a graph from 2006 to 2011 of Middle East & North Africa (excluding high income). No data until 2005. Number of actual observations by date: 5.
Source name:
World Development Indicators
Source organization:
International Monetary Fund, Balance of Payments Statistics Yearbook and data files.
Categories, topics:
Economy & Growth, Private Sector, Trade
Last updated:
apr 23, 2017
Indicators value changes by year
Meaning:
2.63
Minimum:
1.834
jan 1, 2007
Maximum:
4.42
jan 1, 2011
At the date of observation
Value
Absolute change
Change from the previous value
jan 1, 2006
2.731
+2.731
0.0%
jan 1, 2007
1.834
-0.896
-32.82%
jan 1, 2009
2.133
+0.298
16.25%
jan 1, 2010
2.031
-0.102
-4.77%
jan 1, 2011
4.42
+2.389
117.64%
Ranking of countries by current statistics by years