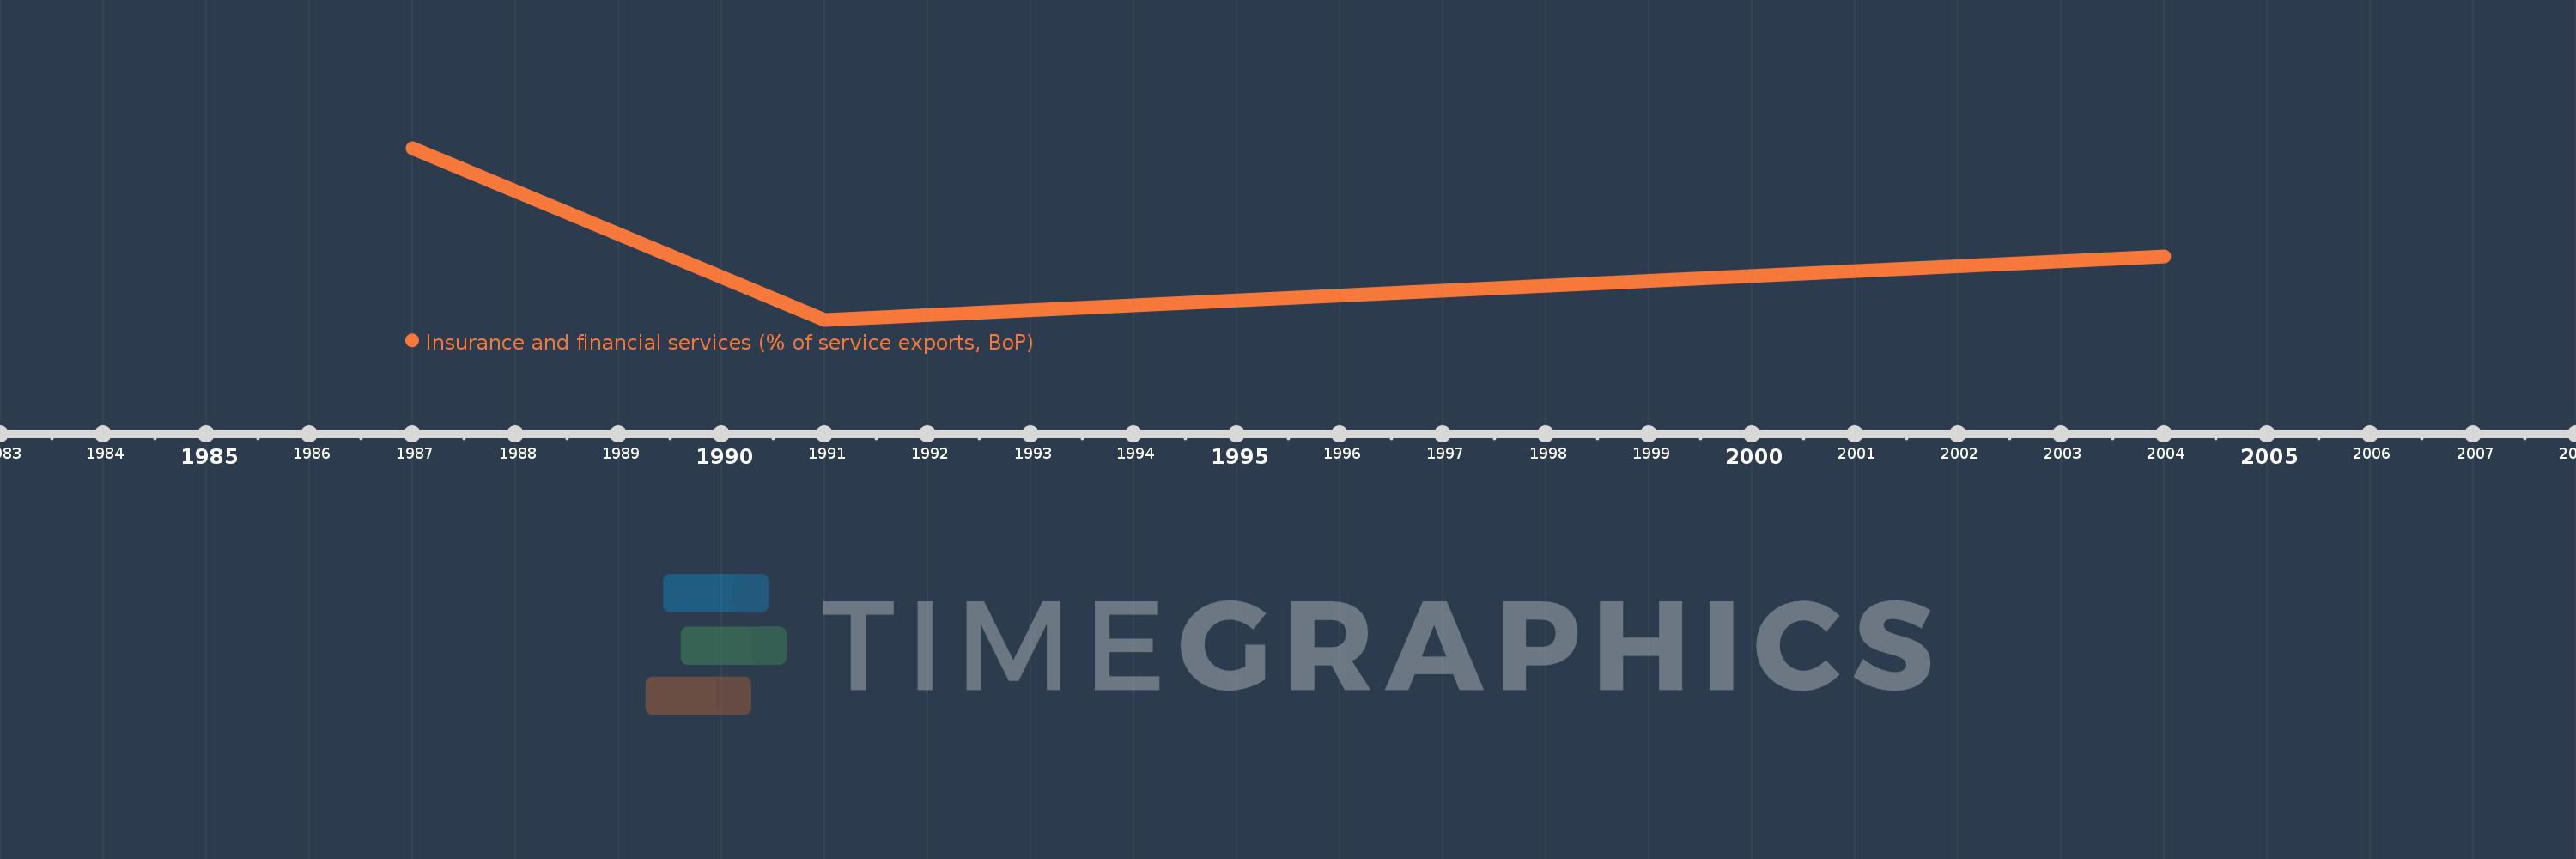
This timeline shows a graph from 1987 to 2004 of Least developed countries: UN classification. No data until 1986. Number of actual observations by date: 3.
Source name:
World Development Indicators
Source organization:
International Monetary Fund, Balance of Payments Statistics Yearbook and data files.
Categories, topics:
Economy & Growth, Private Sector, Trade
Last updated:
apr 23, 2017
Indicators value changes by year
Meaning:
1.823
Minimum:
1.637
jan 1, 1991
Maximum:
2.044
jan 1, 1987
At the date of observation
Value
Absolute change
Change from the previous value
jan 1, 1987
2.044
+2.044
0.0%
jan 1, 1991
1.637
-0.407
-19.93%
jan 1, 2004
1.787
+0.151
9.21%
Ranking of countries by current statistics by years