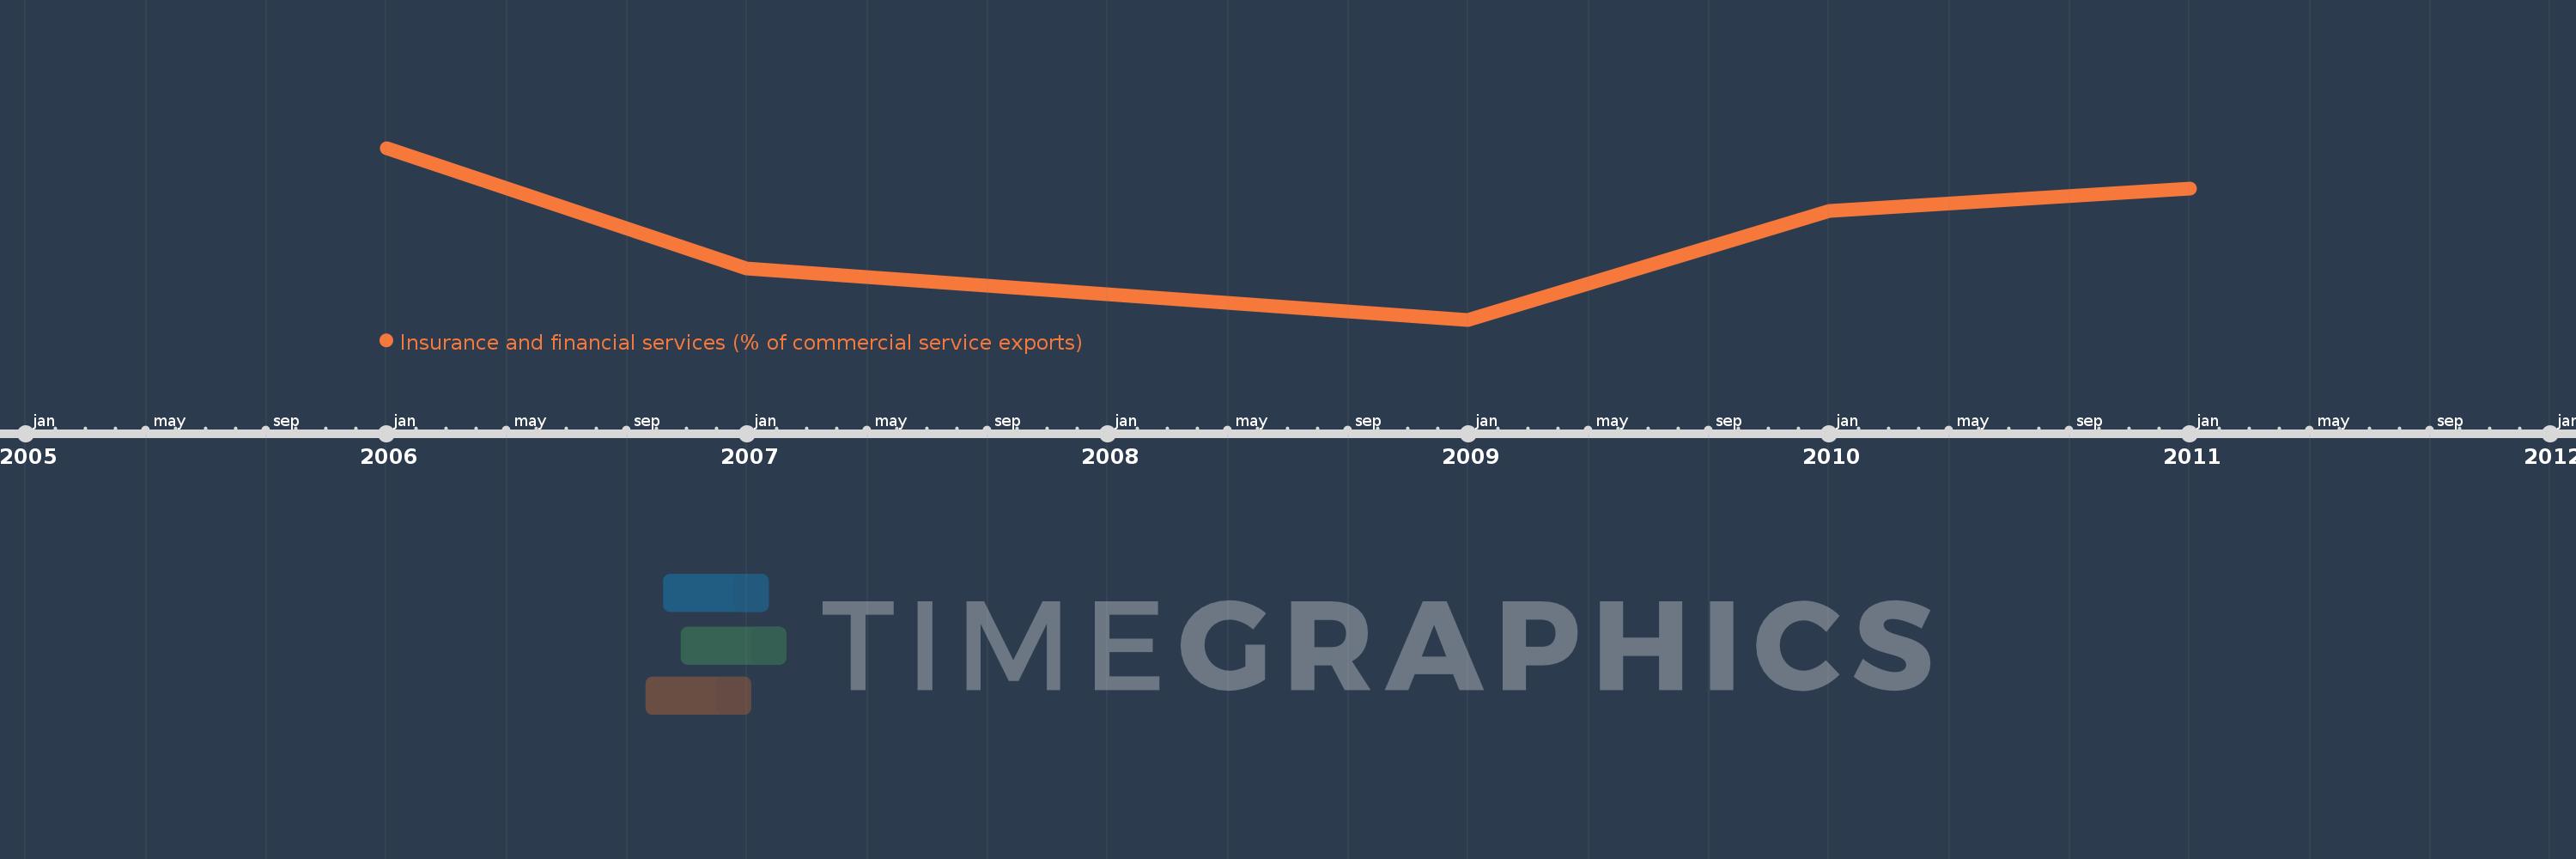
This timeline shows a graph from 2006 to 2011 of Middle East & North Africa (excluding high income). No data until 2005. Number of actual observations by date: 5.
Source name:
World Development Indicators
Source organization:
International Monetary Fund, Balance of Payments Statistics Yearbook and data files.
Categories, topics:
Private Sector, Trade
Last updated:
apr 23, 2017
Indicators value changes by year
Meaning:
5.754
Minimum:
3.206
jan 1, 2009
Maximum:
7.927
jan 1, 2006
At the date of observation
Value
Absolute change
Change from the previous value
jan 1, 2006
7.927
+7.927
0.0%
jan 1, 2007
4.623
-3.303
-41.67%
jan 1, 2009
3.206
-1.418
-30.67%
jan 1, 2010
6.199
+2.994
93.38%
jan 1, 2011
6.813
+0.614
9.91%
Ranking of countries by current statistics by years