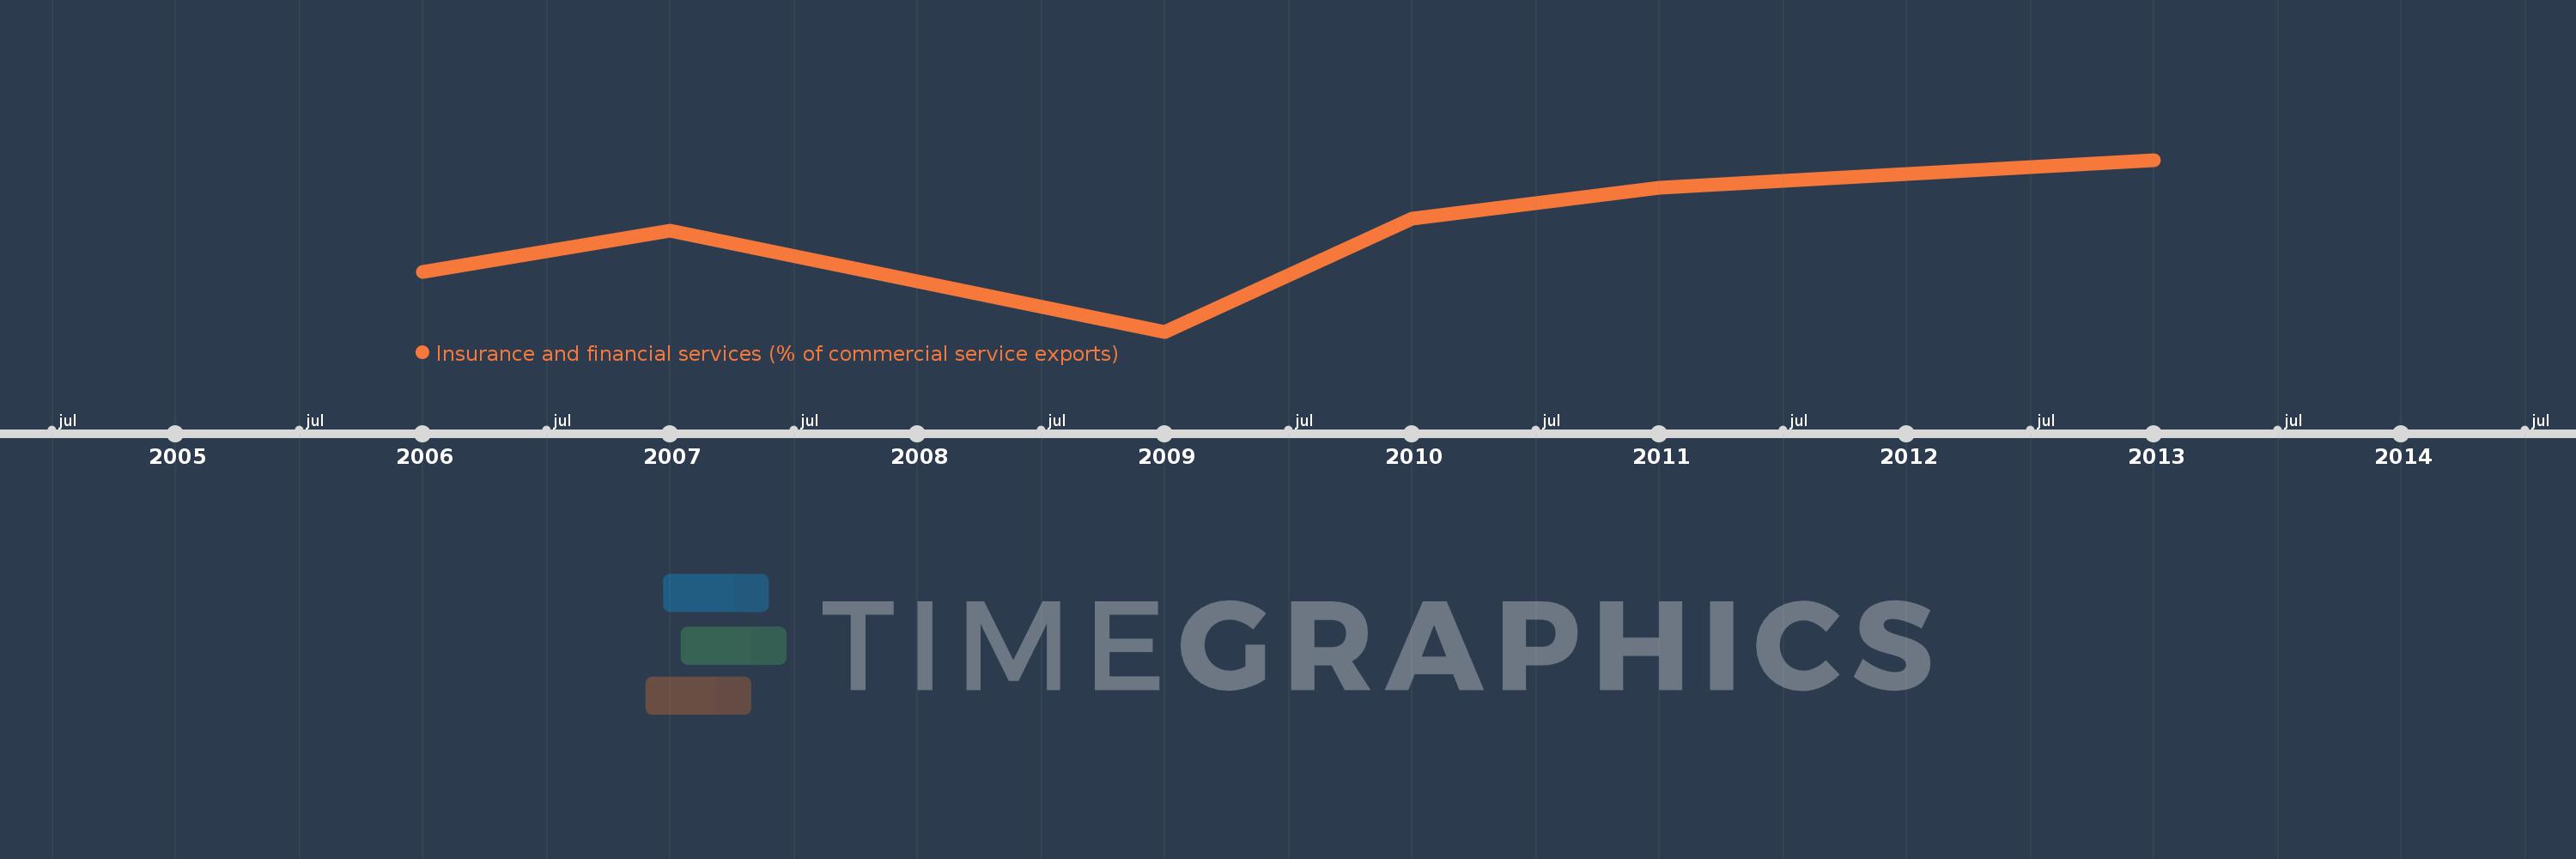
This timeline shows a graph from 2006 to 2013 of Fragile and conflict affected situations. No data until 2005. Number of actual observations by date: 6.
Source name:
World Development Indicators
Source organization:
International Monetary Fund, Balance of Payments Statistics Yearbook and data files.
Categories, topics:
Private Sector, Trade
Last updated:
apr 23, 2017
Indicators value changes by year
Meaning:
6.964
Minimum:
3.978
jan 1, 2009
Maximum:
9.193
jan 1, 2013
At the date of observation
Value
Absolute change
Change from the previous value
jan 1, 2006
5.799
+5.799
0.0%
jan 1, 2007
7.05
+1.25
21.56%
jan 1, 2009
3.978
-3.072
-43.58%
jan 1, 2010
7.413
+3.435
86.36%
jan 1, 2011
8.349
+0.936
12.63%
jan 1, 2013
9.193
+0.843
10.1%
Ranking of countries by current statistics by years