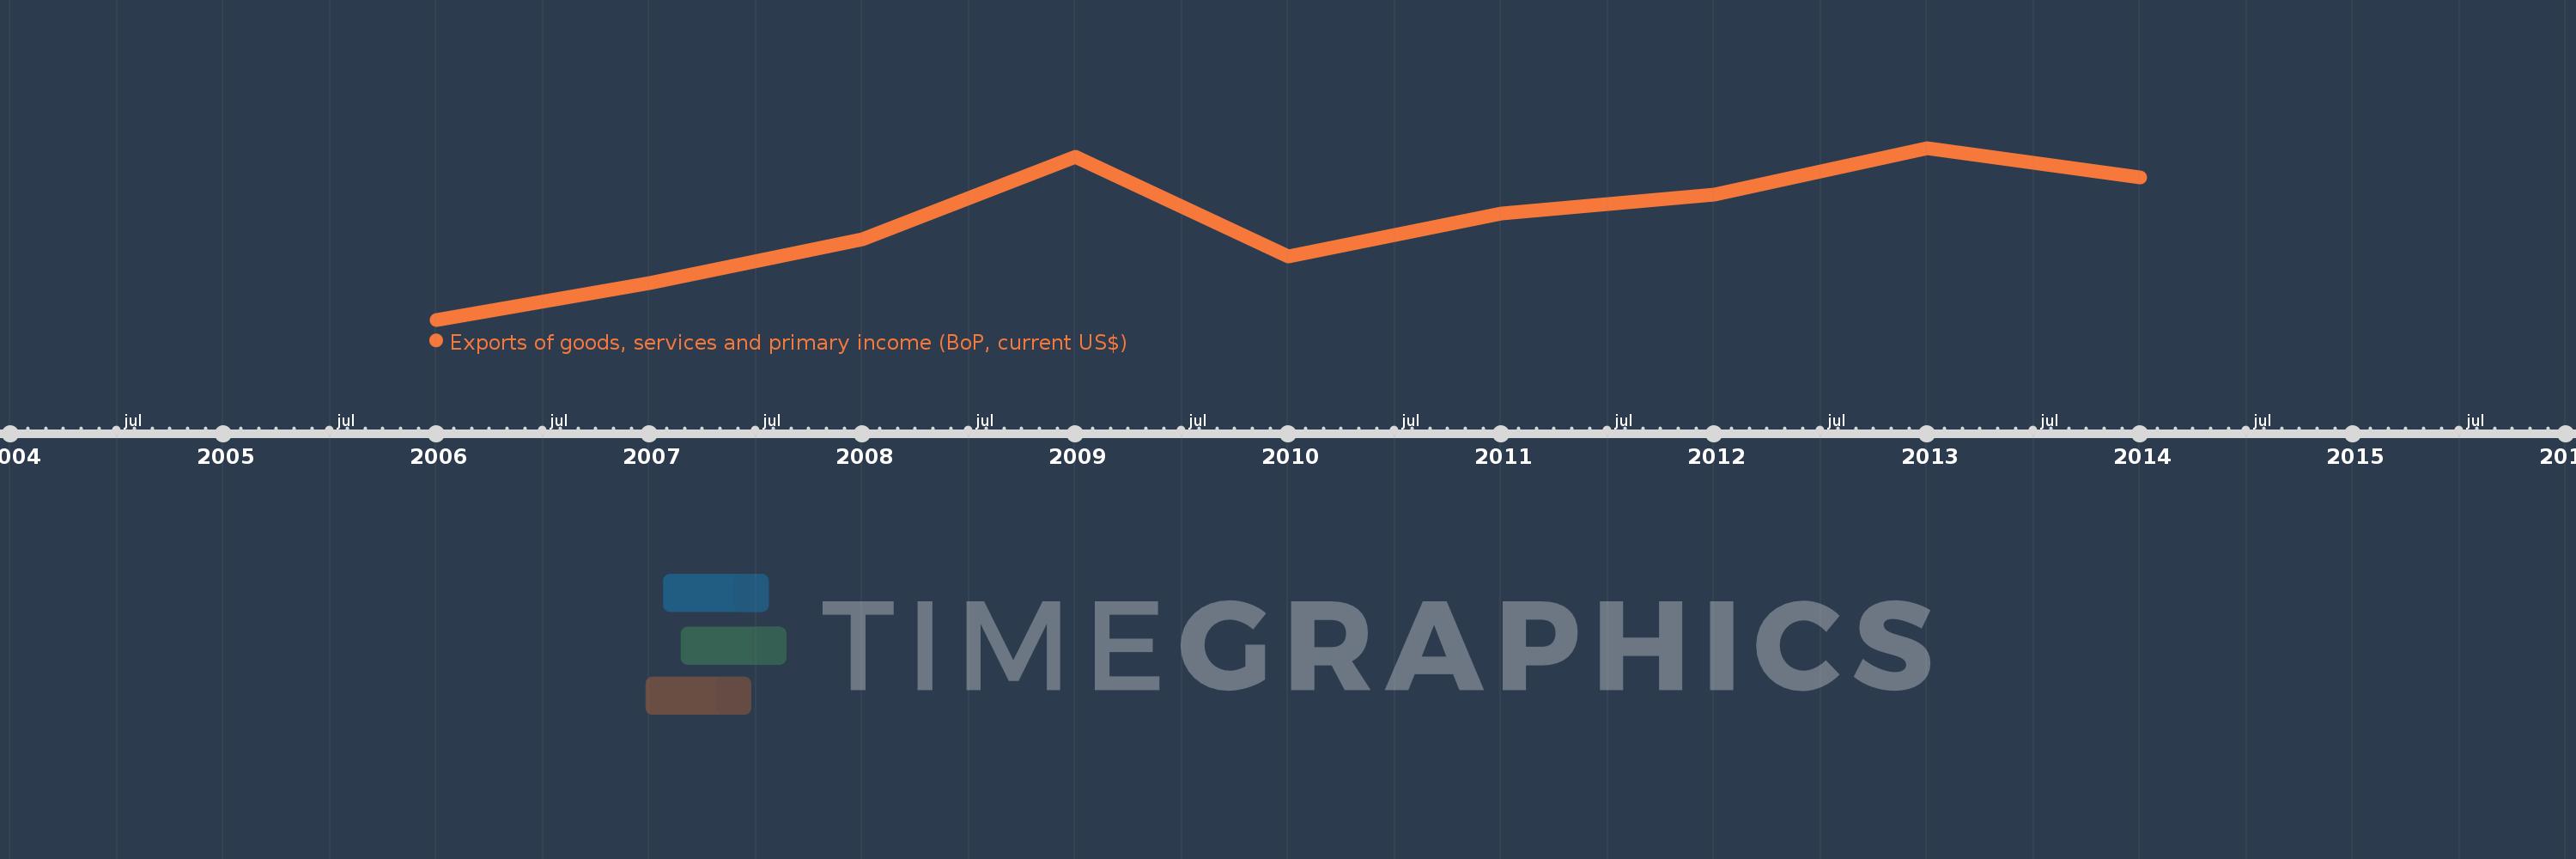
This timeline shows a graph from 2006 to 2014 of Middle East & North Africa (excluding high income). No data until 2005. Number of actual observations by date: 9.
Source name:
World Development Indicators
Source organization:
International Monetary Fund, Balance of Payments Statistics Yearbook and data files.
Categories, topics:
Economy & Growth, External Debt, Trade
Last updated:
apr 23, 2017
Indicators value changes by year
Meaning:
465.36 bln
Minimum:
298.761 bln
jan 1, 2006
Maximum:
588.905 bln
jan 1, 2013
At the date of observation
Value
Absolute change
Change from the previous value
jan 1, 2006
298.761 bln
+298.761 bln
0.0%
jan 1, 2007
360.091 bln
+61.33 bln
20.53%
jan 1, 2008
435.333 bln
+75.242 bln
20.9%
jan 1, 2009
573.391 bln
+138.058 bln
31.71%
jan 1, 2010
405.033 bln
-168.357 bln
-29.36%
jan 1, 2011
477.738 bln
+72.705 bln
17.95%
jan 1, 2012
509.663 bln
+31.924 bln
6.68%
jan 1, 2013
588.905 bln
+79.242 bln
15.55%
jan 1, 2014
539.326 bln
-49.579 bln
-8.42%
Ranking of countries by current statistics by years